Chapter 5
Script is a higher-level programming language, which is part of the report. Script can be written in one of the following .Net languages:
C#
VisualBasic.Net
A script is applicable in many places. Using the script, you can do the following:
perform data handling, which cannot be done via regular means of the FastReport engine;
control the printing of report pages and bands on the page;
control the interaction between elements on dialogue forms;
control the formation of dynamic "Table" objects;
and many more.
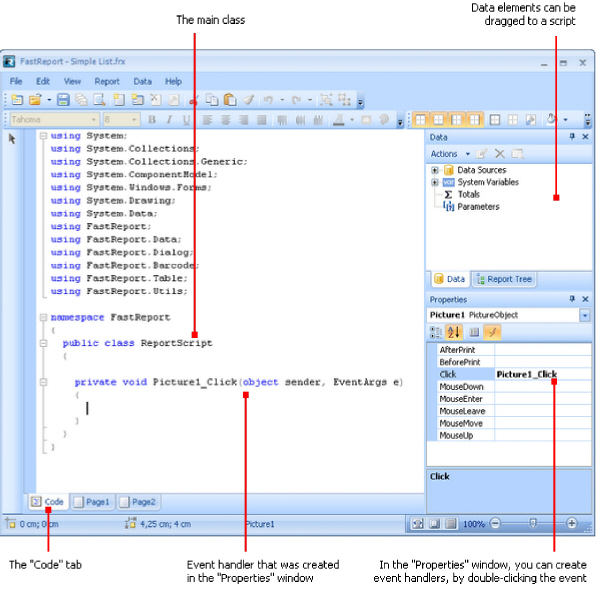
In order to see the report's script, switch to the "Code" tab in the designer:
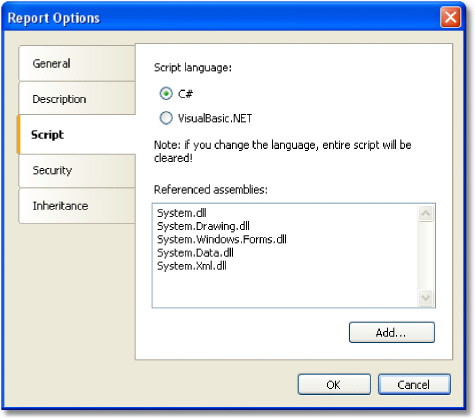
Script language can be set in the "Report|Options..." menu. This is supposed to be done just after you have created a new report, because when changing the language, the existing script gets deleted.
Contrary to other report generators, script in FastReport contains only what you have written. In the script, you can:
add your variables, methods and properties to the main script class;
create a report object's events handler;
add new classes to the script, if needed. A class can be added either before the ReportScript main class or after it.
You cannot:
delete, rename or change the visibility area of the ReportScript main class;
rename a namespace in which the main class is located.
When the report is running, the following occurs:
FastReport adds into the script a list of variables, whose names corresponds with the names of the report objects. This is done before compiling the script and allows you to refer to the report objects by their names;
an expression handler is added to the script, which handles all expressions found in the report;
a script is compiled, if it is not empty;
the script class is initialized;
the report is run.
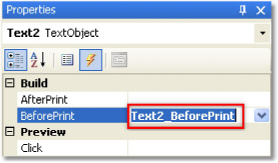
A script is mainly used for creating objects' event handlers. For creating event handler select
the
needed object. In the "Properties" window, press the ![]() button,
in order to switch on the list of events:
button,
in order to switch on the list of events:
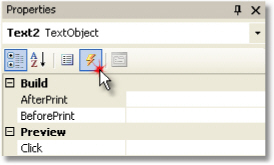
Select the event you want and double click it. FastReport adds an empty event handler into the report code:
private void Text2_BeforePrint(object sender, EventArgs e)
{
}
The "Report" object has got events as well. This object can be chosen by the following
method:
select "Report" in the "Report Tree" window;
select "Report" in the drop-down list in the "Properties" window.
In order to delete the event handler, choose an event in the "Properties" window, select the text and press the Delete key:
In order to control the report with maximum flexibility, every report object has got several events. For example, in a handler, connected to the "Data" band, you can filter records, that is, hide or show the band depending on certain conditions.
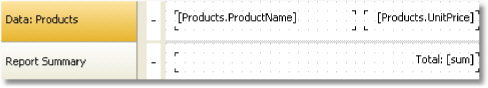
Let us consider the events which are fired during the report generation process. As an example, we will take a simple report, containing one page, one "Data" band and two "Text" objects on the band:
![]()
In the beginning of the report, the "Report" object fires the StartReport event. Before formation of the report page, the StartPage event is fired. This event is fired once for every template page (do not confuse with prepared report page!). In our case, regardless of how many pages were in the prepared report - event is fired once, since the template report has got one page.
Further, printing of the "Data" band row starts. This happens in the following way:
1.the BeforePrint band event is fired;
2.the BeforePrint event of all objects lying on the band is fired;
3.all objects are filled with data;
4.the AfterData event of all objects lying on the band is fired;
5.the BeforeLayout band event is fired;
6.objects are placed on the band, the height of the band is calculated and band is stretched (if it can);
7.the AfterLayout band event is fired;
8.if the band cannot fit on a free space on the page, a new page is formed;
9.the band and all its objects are displayed on a prepared report page;
10.the AfterPrint band event is fired;
11.the AfterPrint event of all the band objects is fired.
Printing of the band row occurs as long as there is data in the source. After this, the formation of the report in our case ends. The FinishPage event of a page is fired and finally - the FinishReport event of the "Report" object.
So, by using events of different objects, you can control every step of report formation. The key to correct use of events - full understanding of the band printing process, expound in the eleven steps above. So, a lot of operations can be done, by using only the BeforePrint band -any change, done to the object, will also be displayed. But in this event, it is not possible to analyze, on which page will the band be printed, if it stretches, because the height of the band will be calculated on step 6. This can be done with the help of the AfterLayout event in step 7 or AfterPrint in step 10, but in the latter case, the band is already printed and operations with objects do not give out anything. In one word, you must clearly state, at what moment each event is fired and use, those, which correspond with the given task.
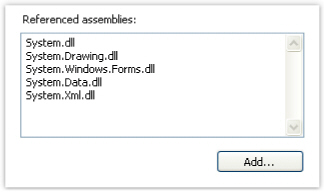
In a script, you can use any .Net objects, which are defined in the following assemblies:
System.dll
System.Drawing.dll
System.Windows.Forms.dll
System.Data.dll
System.Xml.dll
Apart from that, you can use any object, defined in the FastReport assembly. If you need access to another assembly, add it to the list of assemblies. This can be done in the "Report| Options..." menu, by choosing the "Script" tab:
For example, if you want to use a function in your report which was declared in your application, add application assembly (.exe or .dll) in a report assemblies list. After that you can call the function by using namespace of your application. For example, if the following function is defined in application:
namespace Demo
{
public static class MyFunctions
{
public static string Func1()
{
return "Hello!";
}
}
}
Calling it in the script can be done in the following way:
string hello = Demo.MyFunctions.Func1();
If you add the "using Demo" line at the top of the report's script, it will allows you to shorten the syntax:
string hello = MyFunctions.Func1();
For referring to report objects (for example, "Text" object) use the name of the object. The following example returns the height of Text1 object:
float height = Text1.Height;
Note that report's native unit of measurement is screen pixels. Keep it in mind when using such object's properties like Left, Top, Width, and Height. To convert pixels into centimeters and back, use the constants, defined in the "Units" class:
float heightInPixels = Text1.Height;
float heightInCM = heightInPixels / Units.Centimeters; Text1.Height = Units.Centimeters * 5; // 5afii10083afii10078
Apart from objects, which are contained in the report, there are two variables defined in the script: Report and Engine.
The Report variable refers to the current report. In the list below, a list of the report object's methods is given:
Method |
Description |
object Calc( |
Calculates an expression and returns the value. When calling this method the first time, an expression gets compiled, which needs some time. |
object GetColumnValue( |
Returns the value of the data column. The name must be presented in the "DataSource.Column" form. If the column has got the null value, it is converted into a value by default (0, empty string, false). |
object GetColumnValueNullable( |
Returns the value of the data column. Contrary to the previous method, it does not get converted into a default value and may be null. |
Parameter GetParameter( |
Returns the reports parameter with the indicated name. Name can be compounded when referring to the nested parameter: "MainParam.NestedParam". |
object GetParameterValue( |
Returns the value of the report parameter with the indicated name. |
void SetParameterValue( |
Sets the value of the report parameter with the indicated name. |
object GetVariableValue( |
Returns the value of the system variable, for example, "Date". |
object GetTotalValue( |
Returns the value of the total, defined in the "Data" window, by its name. |
DataSourceBase GetDataSource( |
Returns the data source, defined in the report, by its name. |
The Engine object is an engine that controls the report creation. By using the methods and properties of the engine, you can manage the process of placing bands onto the page. You can use the following properties of the Engine object:
Property |
Description |
float CurX |
Current coordinates on the X-axis. This property can be assigned a value, so as to shift the printed object. |
float CurY |
Current printing position on the Y-axis. To this property, a value can be assigned so as to shift the printed object. |
int CurColumn |
Number of the current column in a multicolumn report. The first column has the number 0. |
int CurPage |
Number of the page being printed. This value can be received from the "Page" system variable. |
float PageWidth |
Width of the page minus the size of the left and right margins. |
float PageHeight |
Height of the page minus the size of the top and bottom margins. |
float PageFooterHeight |
Height of the page footer (and all its child bands). |
float ColumnFooterHeight |
Height of the column footer (and all of its child bands). |
float FreeSpace |
Size of the free space on the page. |
bool FirstPass |
Returns true, if the first (or only) report pass is being executed. Number of passes can be obtained from the Report.DoublePass property. |
bool FinalPass |
Returns true, if the last (or only) report pass is being executed. |
On the figure below, you can see the meaning of some properties listed above.
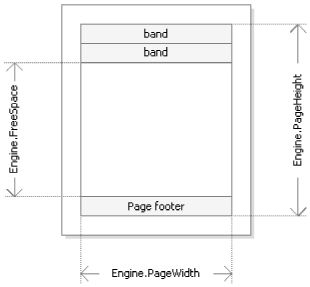
Engine.PageWidth and Engine.PageHeight properties determine the size of the printing area, which is almost always less than the actual size of the page. Size of the printed area is determined by the page margins, which is given by the LeftMargin, TopMargin, RightMargin and BottomMargin page properties.
Engine.FreeSpace property determines the height of the free space on the page. If there is the "Page footer" band on the page, its height is considered when calculating the FreeSpace. Note that, after printing a band, free space is reduced.
How does the formation of a prepared report page take place? FastReport engine displays bands on the page until there is enough space for band output. When there is no free space, the "Report footer" band is printed and a new empty page is formed. Displaying a band starts from the current position, which is determined by the X and Y coordinates. This position is retuned by the Engine.CurX and Engine.CurY properties. After printing a band, CurY automatically increases by the height of the printed band. After forming a new page, the position of the CurY is set to 0. The position of the CurX changes when printing a multicolumn report.
Engine.CurX
and Engine.CurY properties are accessible not only for reading, but also
for writing. This means that you can shift a band manually by using
one of the suitable events. Examples
of using these properties can be seen in the "Examples" section.
When working with properties, which return the size or position, remember that, these properties are measured in the screen pixels.
In the Engine object, the following methods are defined:
Method |
Description |
|
void AddOutline(string text) |
Adds an element into the report outline (read the chapter "Interactive reports") and sets the current position to the added element. |
|
void OutlineRoot() |
Sets the current position on the root of the outline. |
|
void OutlineUp() |
Shifts the current position to a higher-level outline element. |
|
void AddBookmark(string name) |
Adds a bookmark (read the chapter
"Interactive
reports" |
|
int GetBookmarkPage(string |
name)Returns the page number on which the bookmark with the indicated name is placed. |
|
void StartNewPage() |
Starts a new page. If the report is multicolumn, a new column is started. |
|
By using the AddOutline, OutlineRoot, OutlineUp methods, you can form the report outline manually. Usually, this is done automatically with the help of the OutlineExpression property, which every band and report page have got.
The AddOutline method adds a child element to the current outline element, and makes it current. The current report page and the current position on the page are associated with the new element. If you call the AddOutline method several times, then you will have the following structure:
Item1
Item2
Item3
For controlling the current element, there are OutlineUp and OutlineRoot methods. The first method moves the pointer to the element, located on a higher level. So, the script
Engine.AddOutline("Item1");
Engine.AddOutline("Item2");
Engine.AddOutline("Item3");
Engine.OutlineUp();
Engine.AddOutline("Item4");
will create the following outline:
Item1
Item2
Item3
Item4
The OutlineRoot method moves the current element to the root of the outline. For example, the following script:
Engine.AddOutline("Item1");
Engine.AddOutline("Item2");
Engine.AddOutline("Item3");
Engine.OutlineRoot();
Engine.AddOutline("Item4");
will create the following outline:
Item1
Item2
Item3
Item4
For working with bookmarks, the AddBookmark and GetBookmarkPage methods of the Engine object are used. Usually bookmarks are added automatically when using the Bookmark property, which all objects of the report have got.
By using the Add Bookmark method, you can add a bookmark programmatically. This method creates a bookmark on the current page at the current printing position.
The GetBookmarkPage method returns the page number on which the bookmark is placed. This method is often used when creating the table of contents, for displaying page numbers. In this case, the report must have a double pass.
Contrary to the FastReport expressions (covered in the "Expressions" section), never use square brackets in script for referring to the data sources. Instead of this, use the GetColumnValue method of the Report object, which returns the value of the column:
string productName = (string)Report.GetColumnValue("Products.Name");
As seen, you need to indicate the name of the source and its column. The name of the source can be compound in case, if we are referring to the data source by using a relation. Details about relations can be found in the "Data" chapter. For example, you can refer to a column of the related data source in this way:
string categoryName = (string)Report.GetColumnValue("Products.Categories.CategoryName");
For making the work easier, use the "Data" window. From it you can drag data elements into the script, during this FastReport automatically creates a code for referring to the element.
For referring to the data source itself, use the GetDataSource method of the Report object:
DataSourceBase ds = Report.GetDataSource("Products");
Help on properties and methods of the DataSourceBase class can be received from the FastReport.Net Class Reference help system. As a rule, this object is used in the script in the following way:
// get a reference to the data source
DataSourceBase ds = Report.GetDataSource("Products");
// initialize it
ds.Init();
// enum all rows
while (ds.HasMoreRows)
{
//
get the data column value from the current row
string
productName = (string)Report.GetColumnValue("Products.Name");
// do something with it...
// ...
// go next data row
ds.Next();
}
For reference to system variables, use the GetVariableValue method of the Report object:
DateTime date = (DateTime)Report.GetVariableValue("Date");
A list of system variables can be seen in the "Data" window. From it, you can drag a variable into a script, during this FastReport automatically creates a code for referring to the variable.
For reference to the total value, use the GetTotalValue method of the Report object:
float sales = Report.GetTotalValue("TotalSales");
A list of totals can be seen in the "Data" window. From it, you can drag a total into the script, during this FastReport automatically creates a code for referring to the total.
Total value has got the FastReport.Variant type. It can be used directly in any expression, because the FastReport.Variant type is automatically converted to any type. For example:
float tax = Report.GetTotalValue("TotalSales") * 0.2f;
Reference to the total value can be done at that time when, it is being processed. Usually the total is "ready to use" at the moment of printing the band, on which it is located in the report.
Reference to report parameters
For referring to report parameters, use the GetParameterValue method of the Report object:
int myParam = (int)Report.GetParameterValue("MyParameter");
Parameters can be nested. In this case, indicate the name of the parent parameter and after the period, the name of the child parameter:
Report.GetParameterValue("ParentParameter.ChildParameter")
Parameters have got a definite data type. It is given in the DataType property of the parameter. You must take this into account when referring to parameters. You can see a list of parameters in the "Data" window. From it, you can drag parameters into the script, during this FastReport automatically creates a code for referring to the parameters.
For changing the value of the parameter, use the SetParameterValue method of the report object:
Report.SetParameterValue("MyParameter", 10);
Example 1. Changing object's appearance
In this example we will show how to change the color of the text depending on the value printed in the object. We will be using:
the BeforePrint event;
reference to the data column from script.
Create a simple report having the following appearance:
![]()
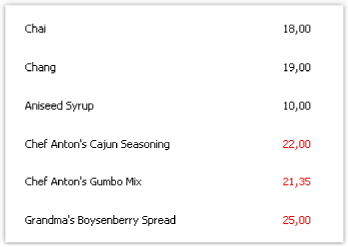
Select the object, which prints the "UnitPrice" column, and create a BeforePrint event handler:
private void Text2_BeforePrint(object sender, EventArgs e)
{
if
(((Decimal)Report.GetColumnValue("Products.UnitPrice"))
> 20)
Text2.TextColor = Color.Red;
}
In order to insert the "Products.UnitPrice" data column into the script, drag it from the "Data" window. During this, the following string will be added in the script:
((Decimal)Report.GetColumnValue("Products.UnitPrice"))
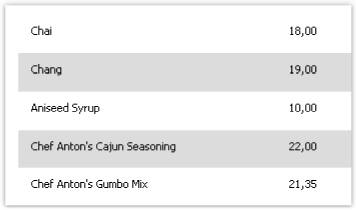
If we run the report, we will see that all the products, having the price > 20, are highlighted in red:
The same effect can be achieved with the help of the conditional highlighting (you can read more about this in the "Conditional highlighting" section of the "Report creation" chapter).
Example 2. Highlighting even rows of the band
In this example we will show how to change the fill color of the "Data" band's even rows. We will be using:
BeforePrint band event;
reference to the "Row#" system variable from the script.
Create a simple report having the following appearance:
![]()
Create a BeforePrint event handler for the band:
private void Data1_BeforePrint(object sender, EventArgs e)
{
if
(((Int32)Report.GetVariableValue("Row#"))
% 2 ==
0)
Data1.FillColor = Color.Gainsboro;
}
The "Row#" system variable returns the number of the row of the printed band. In order to insert into the script a reference to the variable, drag it from the "Data" window. During this, in the script a string will be inserted:
((Int32)Report.GetVariableValue("Row#"))
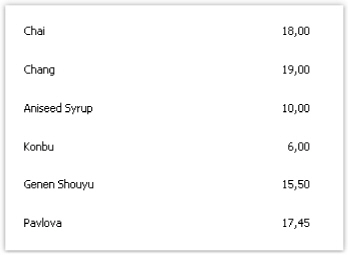
If we run the report, we will see that even rows will be highlighted in light-gray color:
The same effect can be achieved with the help
of the "EvenStyle" property of the "Data" band. You
can read more about this in the "Highlight
odd/even data rows" section of
the "Report
creation" chapter.
In this example, we will show how to hide the "Data" band row depending on the given conditions. We will be using:
BeforePrint band event;
reference to the data source from a script.
Create a simple report having the following appearance:
![]()
Create a BeforePrint event handler for the band:
private void Data1_BeforePrint(object sender, EventArgs e)
{
if
(((Decimal)Report.GetColumnValue("Products.UnitPrice"))
> 20)
Data1.Visible = false;
}
In the given case, the band rows which have the unit price > 20 will be hidden:
The same effect can be achieved by using the data filter which can be set in the "Data" band editor.
In this example, we will show how to calculate the sum by using programming methods. We will use the following:
BeforePrint band event;
reference to the data column from a script;
local variable, whose value will be printed in the report.
Create a report of the following form:
In the script, declare the "sum" variable and create a BeforePrint event handler belonging to the band:
public class ReportScript
{
private decimal sum;
private void Data1_BeforePrint(object sender, EventArgs e)
{
sum += (Decimal)Report.GetColumnValue("Products.UnitPrice");
}
}
The "Products.UnitPrice" data column can be placed into the script, dragging it from the "Data" window.
If you run the report, you will see the following:
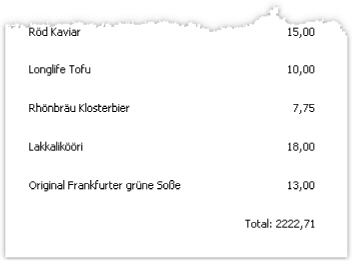
The same effect can be achieved by using totals.
Example 5. Shifting the print position
In this example, we will show how to shift the position of a band manually, by using the Engine object. We will be using:
BeforePrint band event;
Engine object.
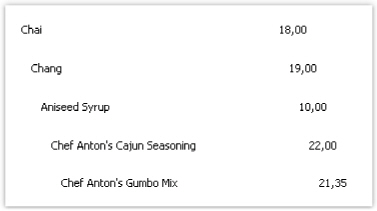
Create a simple report of the following appearance:
![]()
Create a BeforePrint event handler for band:
private void Data1_BeforePrint(object sender, EventArgs e)
{
Engine.CurX = ((Int32)Report.GetVariableValue("Row#")) * 10;
}
If you run the report, you will see the following: