Chapter 6
Apart from an ordinary page, a report can contain one or several dialogue forms. Such dialogue form will be shown when the report is started. In the dialogue, you can enter any type of information, needed for creating a report. Also, a dialogue may be used to filter data, which is shown in the report.
For adding a dialogue into a report, press the![]() button on the designer's toolbar. A
new dialogue looks as follows:
button on the designer's toolbar. A
new dialogue looks as follows:
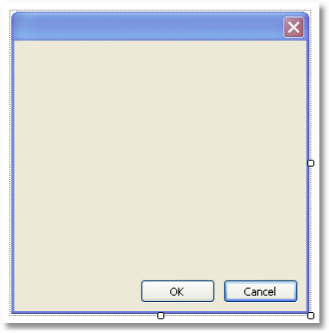
A report, having one or several dialogues, works like this:
when started, the report shows the first dialogue; if the dialogue is closed with the help of the "OcyrillicKacyrillic" button, then the next dialogue is shown; otherwise, the report stops working;
after all the dialogues have been shown, the report is built.
On a dialogue from, the following controls can be used:
Icon |
Name |
Description |
|
ButtonControl |
Represents a Windows button control. |
|
CheckBoxControl |
Represents a Windows CheckBox. |
|
CheckedListBoxControl |
Displays a ListBox in which a check box is displayed to the left of each item. |
|
ComboBoxControl |
Represents a Windows combo box control. |
|
DataGridViewControl |
Displays data in a customizable grid. |
|
DataSelectorControl |
Displays two lists and allows relocating an item from one list to the other. |
|
DateTimePickerControl |
Represents a Windows control that allows the user to select a date and a time and to display the date and time with a specified format. |
|
GroupBoxControl |
Represents a Windows control that displays a frame around a group of controls with an optional caption. |
|
LabelControl |
Represents a standard Windows label. |
|
ListBoxControl |
Represents a Windows control to display a list of items. |
|
ListViewControl |
Represents a Windows list view control, which displays a collection of items that can be displayed using one of four different views. |
|
MaskedTextBoxControl |
Uses a mask to distinguish between proper and improper user input. |
|
MonthCalendarControl |
Represents a Windows control that enables the user to select a date using a visual monthly calendar display. |
|
NumericUpDownControl |
Represents a Windows spin box (also known as an up-down control) that displays numeric values. |
|
PanelControl |
Used to group collections of controls. |
|
PictureBoxControl |
Represents a Windows picture box control for displaying an image. |
|
RadioButtonControl |
Enables the user to select a single option from a group of choices when paired with other RadioButton controls. |
|
RichTextBoxControl |
Represents a Windows rich text box control. |
|
TextBoxControl |
Represents a Windows text box control. |
|
TreeViewControl |
Displays a hierarchical collection of labeled items. |
All controls, except the DataSelectorControl, are a full analog of the standard Windows.Forms controls. The name of the element has got a Control suffix, in order to avoid duplicate names. So, the FastReport's ButtonControl corresponds with the standard Button control.
Referencing to a control from code
Referencing to a control can be done by using its name:
TextBoxControl1.Text = "my text";
In fact, the FastReport's control is just a wrapper for the standard .Net control. It wraps many, but not all, properties of the standard control. If you need some property that is not implemented by the FastReport control, you may access a wrapped standard control in the following way:
using the "Control" property, which is of System.Windows.Forms.Control type:
(TextBox1.Control as TextBox).ShortcutsEnabled = false;
using the property which has the same name as the control itself, but without the "Control" suffix. For example, the TextBoxControl has got the "TextBox" property, which is of System. Windows.Forms.TextBox type and returns the wrapped TextBox control:
TextBox1.TextBox.ShortcutsEnabled = false;
Help on properties and methods of the controls can be accessed from the MSDN.
Dialogs can be used to filter the data which is printed in a report. For example, you have a report, which prints a list of all the employees. By using a dialog, you can choose one or several from it, and then when building the report, the data is filtered so that only the chosen employees can be shown.
For using the data filtering, it is necessary that the initial report contains all the data. The name "filtering" itself, assumes that, unnecessary data will not be printed when building the report.
The simplest method for organizing data filtering is to use the Filter property on the "Data" band. In the band editor, you can indicate the filter expression, for example:
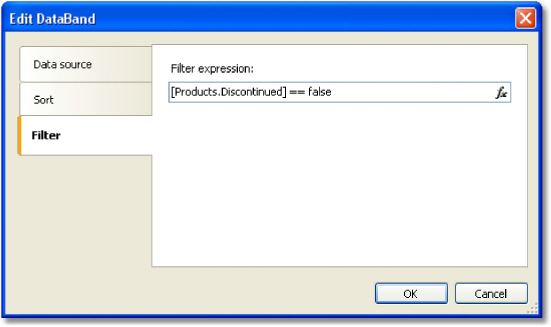
By using the dialogue, you can ask a value from a user, and use it in the filtering expression. Look at the "Simple filter" example in the "Examples" section.
This method can be used, if a simple value is needed. If the task is to display a list of values and inquire one or several from it, implementing this becomes difficult. You may think that, it is a simple task - showing a list of employees in the ListBoxControl control element and choosing one or several values. For implementing this, you need to use the script, which does the following:
get the data source by its name;
initialize data;
fill the ListBoxControl with the data from data source;
after choosing the employee, build a filter expression that will be used in the "Data" band.
FastReport can do this automatically. For this, automatic filtering is used, which we will observe now.
Automatic filtering - how it works
Control is connected to the data column using the "DataColumn" property. If the control can display a list of values (for example, ListBoxControl), it fills with values from the indicated data column. This happens automatically when the dialogue is shown. Further, the user works with the dialogue, selects one or several items in the control and closes the dialogue. At this time, the data source which was indicated in the "DataColumn" property is filtered automatically.
The advantage of this method is that, you can use it in any report without writing any code.
Automatic filtering is supported by the following controls:
Icon |
Name |
|
CheckBoxControl |
|
CheckedListBoxControl |
|
ComboBoxControl |
|
DataSelectorControl |
|
DateTimePickerControl |
|
ListBoxControl |
|
MaskedTextBoxControl |
|
MonthCalendarControl |
|
NumericUpDownControl |
|
RadioButtonControl |
|
TextBoxControl |
By
default FastReport filters the data rows, which contain the value, equal
to the value of the control. This behavior is defined in the "FilterOperation"
property of the control. You can use
the following operations:
Operation |
Equivalent |
Effect |
Equal |
= |
Filter the value if it is equal to the control's value. |
NotEqual |
<> |
Filter the value if it is not equal to the
control's |
LessThan |
< |
Filter the value if it is less than the control's value. |
LessThanOrEqual |
<= |
Filter the value if it is less than or equal
to the |
GreaterThan |
> |
Filter the value if it is greater than the
control's |
GreaterThanOrEqual |
>= |
Filter the value if it is greater than or
equal to the |
For
example, if the "FilterOperation" property of the control is
set to "LessThanOrEqual" and you enter the value 5 in the
control, then all the data rows will be chosen, for which the
corresponding column value is less than or equal to 5.
For the data of "string" type, you can use extra operations:
Operation |
Effect |
Contains |
Filter the value if it contains the control's value. |
NotContains |
Filter the value if it does not contain the control's value. |
StartsWith |
Filter the value if it starts with the control's value. |
NotStartsWith |
Filter the value if it does not start with the control's value. |
EndsWith |
Filter the value if it ends with the control's value. |
NotEndsWith |
Filter the value if it does not end with the control's value. |
For example, if the "FilterOperation" property of the control is set to "StartsWith" and you enter the "A", then, all data rows whose corresponding data column's value starts with "A", will be chosen.
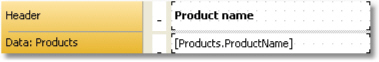
FastReport's dialogue designer has got very comfortable facilities for adding controls, which support the data filtering. For this, drag&drop the data column from the "Data" window onto the dialogue from. During this, FastReport creates the header (LabelControl control) and an actual control which will be used for data filtering:
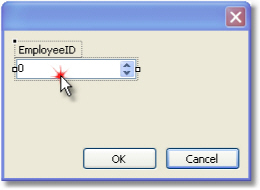
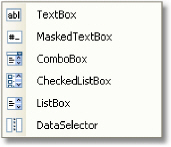
The control type depends on the type of the data column. If the column is of string type, then after inserting it, you will be offered to choose the control type:
If you have inserted two similar controls, connected to the same data column, FastReport automatically configures the data range with the help of the "FilterOperation" property. The first control will have FilterOperation = GreaterThanOrEqual, the second - LessThanOrEqual. This will be done in case, if you insert a column which is not of string type.
As such, for adding data filtering into any report, you need to do the following:
add a new dialogue into the report;
drop onto the dialogue a data column, on which you want to filter the report.
This method of filtering is comfortable for using when working with values, having a quantitative characteristic, for example, the cost. You can filter goods, having the cost less than or more than the given. In order to indicate, how to interpret the value entered in the element, use the "FilterOperation" property, looked at above.
Using two controls, which are connected to the same data column and have got different settings of the "FilterOperation" property, you can indicate the beginning and the ending of the data range. For the first control, you need to indicate the FilterOperation = GreaterThanOrEqual, for the second - LessThanOrEqual.
Filtering on related data column
As we know, between two data sources, a relation can be set. See more details in the "Data" chapter. With the help of relation, it is possible to filter data in the source, by using a data column from a different source.
Assuming, you have placed on the dialogue a ListBoxControl and indicated the following data column in the "DataColumn" property:
Products.Categories.CategoryName
How will filtering work?
when filling the control with values, the "CategoryName" column from the "Categories" data source will be used;
the filter will be applied to the "Products" table. Those data rows will be filtered for which the following condition is correct:
the [Products.Categories.CategoryName] contains one of the values, selected by the user
Filtering using cascading lists
A cascading list is a list with choices that change based on the value a user selects in another list. For example, you have two lists on a form - one with categories, another one with products. When you choose a category in the first list, you will see in the second list the products in a chosen category.
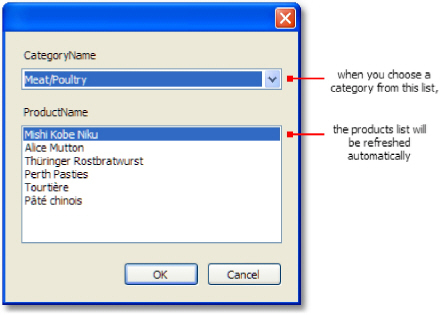
To create a cascading list, you need to use two data sources with master-detail relation between them (read more about data sources and relations in the "Data" chapter). Attach the master list to a column in the master data source; attach the detail list to a column in the detail data source. Also set the master list's "DetailControl" property to the detail list.
Controlling the filtering from code
Even if automatic filtering is enough for many cases, you have the possibility of managing it manually. For this, the following methods and properties are used.
The "AutoFill" property controls the filling of controls with data. It is used by controls, which can show a list of values, for example, the ListBoxControl. Before showing a dialogue, FastReport fills such controls with data. By default, the property is set to true. If it is disabled, the control will not be filled, and you must do it yourself, by calling the "FillData" method:
ListBox1.FillData();
The "AutoFilter" property controls the data filtering. It is used by all controls. After the dialogue has been closed by the "OcyrillicKacyrillic" button, FastReport applies data filter automatically. By default, the property is set to true. If it is disabled, the filtering will not happen, and you must do it yourself, by calling the "FilterData" method:
ListBox1.FilterData();
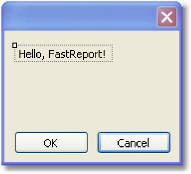
Example 1. "Hello, FastReport!"
In this example, all we will do - create a dialogue, which will be showing greetings. Create a
new
report and add a dialogue to into. For this, press the ![]()

On the dialog, place the LabelControl and set its "Text" property in the "Properties" window:
If you run the report, you will see the dialogue. Close it by the "OcyrillicKacyrillic" button, and the report will be built. If the dialogue is closed by the "Cancel" button or by the "X" button, the report will stop working, and you return to the designer.
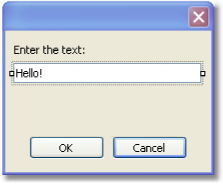
Example 2. Ask for a text from the user
In this example, we will create a dialogue, which will be asking for an arbitrary text from the user and later print the entered value in the report.
Create a new report and add a dialogue into it. On the dialogue, place LabelControl and TextBoxControl controls:
In the given case, the value we have entered is contained in the "Text" property of the TextBoxControl. In order to print this value in the report, add a new "Text" object on the "Report Title" band and write the following in it:
You have entered: [TextBox1.Text]
where TextBox1 is a name of the TextBoxControl control.
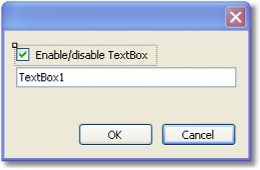
Example 3. Handling dialogue controls
By using the script and events of the controls, you can handle controls just like it is done in Visual Studio. We will show by example, how the CheckboxControl can handle the TextBoxControl accessibility.
Create a new report and add a dialogue into it. On the dialogue, place the CheckBoxControl and TextBoxControl controls, as shown in the figure below:
Now
select the CheckBoxControl, open the "Properties" window and
click the ![]() button. Double click the "CheckedChanged"
event, which is fired when changing the status of the checkbox. FastReport
will create an empty handler for that event. Write the following code
in it:
button. Double click the "CheckedChanged"
event, which is fired when changing the status of the checkbox. FastReport
will create an empty handler for that event. Write the following code
in it:
private void CheckBox1_CheckedChanged(object sender, EventArgs e)
{
TextBox1.Enabled = CheckBox1.Checked;
}
If we run the report, we can enable or disable the TextBoxControl by the checkbox.
Example 4. Handling report objects
Let us look at an example of a report, which prints a list of categories and products in each category:
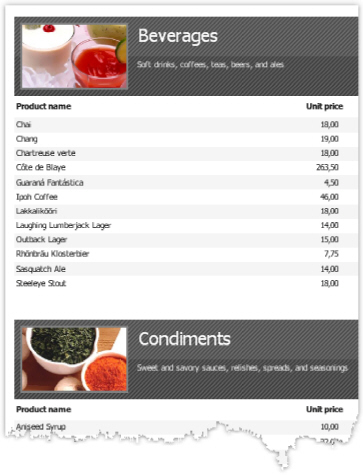
We will show how to stop printing products and print just categories, with the help of the dialogue. For this, add a dialogue into the report:
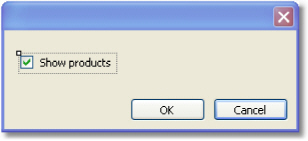
Double click on the "OcyrillicKacyrillic" button. FastReport creates an empty event handler for the "Click" event. Write the following code in it:
private void btnOk_Click(object sender, EventArgs e)
{
Data2.Visible = CheckBox1.Checked;
}
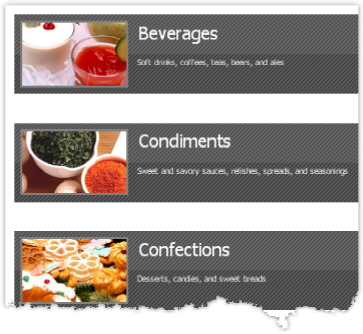
We will control the visibility of the band, which prints the product's list. In our example, this is a band with a name "Data2". If the report is run, and the checkbox is unchecked, we will have the following result:
Let us look at the following report, which prints a products list:
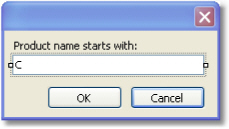
We will show in this example how to filter a products list according to the first letter of the product's name. During this, we will not use automatic data filtering facilities. For this, add a new dialog into the report and place two controls onto it - LabelControl and TextBoxControl:
Now open the "Data" band editor and indicate the following filter expression:
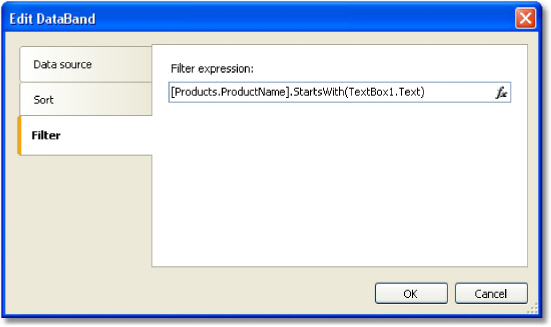
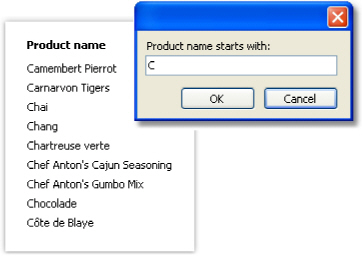
Run the report and make sure that everything works:
Example 6. Automatic filtering
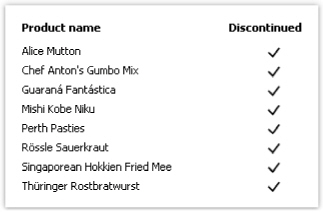
In this example we will show how to add a filter into the report which prints a product's list from the "Products" table. We will filter the data according to the "Products.Discontinued" column.
The report looks as follows:
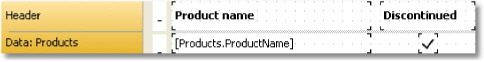
Add
a new dialogue into the report by pressing the ![]() button
on the toolbar, and drag the "Products.Discontinued" column
from the "Data" window onto the dialogue form:
button
on the toolbar, and drag the "Products.Discontinued" column
from the "Data" window onto the dialogue form:
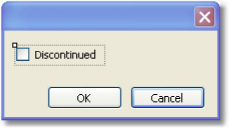
This is all we need to do - we did it just by two clicks. FastReport automatically connects the control to the data column.
Run the report and enable the Discontinued flag. After that, press the "OcyrillicKacyrillic" button, and you will see the report which contains only products with the Discontinued flag:
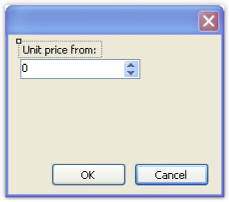
Example 7. Automatic filtering by range
We will show with a report from the previous example, how to print products having the cost in the indicated range. For that we will add a dialogue into the report and drag "Products. UnitPrice" data column into it. After that we will correct the label text:
Now, in the same way, add one more "Products.UnitPrice" column and correct its header:
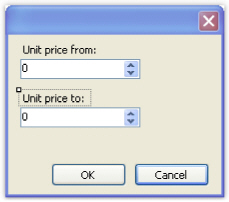
That is all we need to do, the rest of the work FastReport has done: connected the controls to the data column and set up their FilterOperation properties. The first control has got FilterOperation = GreaterThanOrEqual, the second - LessThanOrEqual.
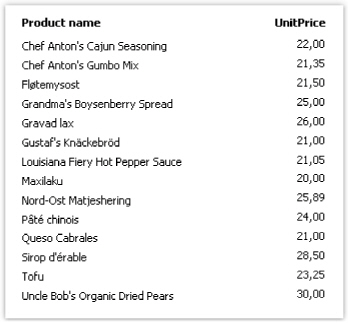
Run the report and indicate the values, for example from 20 up to 30. When pressing the "OcyrillicKacyrillic" button, a report will be built. It contains products having values in the indicated range.
Example 8. Filtering by related data column
In this example, we will use a column from a related data source to perform data filtering.
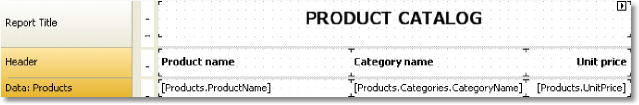
We will look at a "Simple list" report type, which prints products list. Category name is printed beside each product. This is done with the help of the relation:
[Products.Categories.CategoryName]
The report will be as follows:
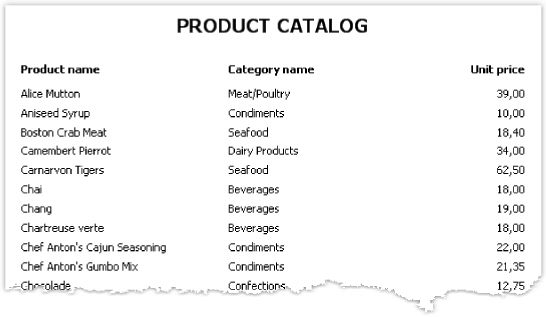
When we run the report, we will see the following:
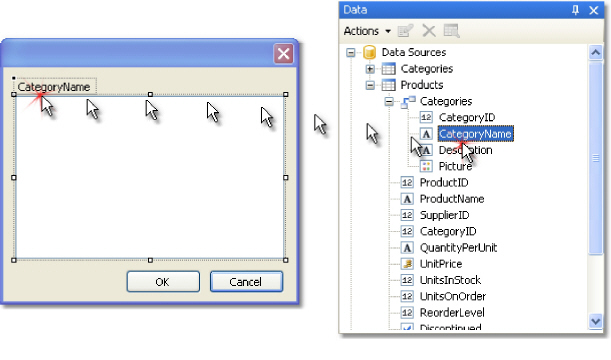
Let us add filtering by category name. For this, add a new dialogue and drag the "Products. Categories.CategoryName" column onto it:
When creating control, you will be required to select its type. Choose CheckedListBoxControl. If we run the report, we will see the following dialogue:
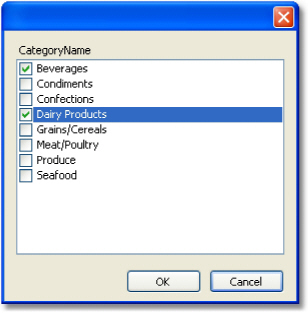
Choose several categories and click the "OcyrillicKacyrillic" button. After this, the data will be filtered and you will see the following report:
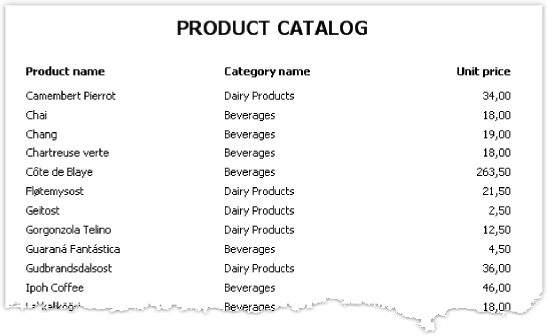
As seen, only products have remained, which are in the chosen category.