Chapter 2
In this chapter we will look at the methods of creating common types of reports. In order to create any report, as a rule, you need to do the following:
1.Choose or create data, which will be used in the report.
2.Create the report structure, by adding the needed bands into the report.
3.Connect the band to a data source.
4.Place the "Text" objects on the bands to print data.
5.Setup the appearance, formatting.
Before you start building a report, you need to choose the data which will be printed in the report. You can do this in two ways:
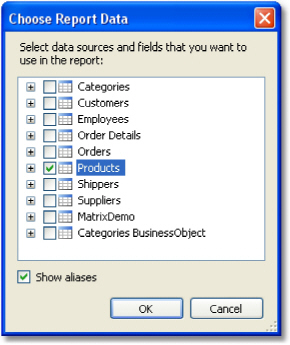
you can choose one of the data sources, which was registered in the report by a programming method. This can be done in the "Data|Choose Report Data..." menu, by marking the needed data source:
you create a new data source in the "Data|New Data Source..." menu.
Read more about data sources in the "Data sources" chapter.
Just after you have chosen the data source, it appears in the "Data" window. Now you can use this source in the report. Many reports use only one data source. For reports of "master-detail" type, you need to choose two data sources, related to each other (you can read more about relations in the "Data sources" chapter). Several data sources can also be needed in a report, which prints data from related sources.
It is necessary often to print a text whose size is not known when creating a report. For example, this can be a description of goods. In this case, the following tasks will need to be solved:
calculate the height of the object, such that it encloses the whole text;
calculate the height of the band, such that it encloses the object with a variable amount of texts;
move or change the height of other objects, which are contained on the band, such that, they do not disturb the general design of the report.
These tasks can be solved by using some object and band properties:
"CanGrow" and "CanShrink" properties allow calculating the height of the object automatically;
"ShiftMode" property allows moving objects that are located under the objects that expand;
"GrowToBottom" property allows resizing an object to the bottom edge of the band;
"Anchor" and "Dock" properties allow controlling the size of objects depending on the size of the band.
All these properties will be looked at below.
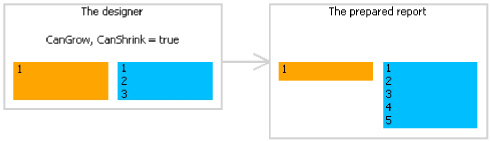
Every band and report object has these properties. They determine whether an object can grow or shrink depending on the size of its contents. If both properties are disabled, the object always has the size specified in the designer.
These properties are very useful, if it is needed to print a text whose size is not known when designing. In order for an object to accommodate the entire text, it needs to have the "CanGrow" and "CanShrink" properties enabled:
The following objects can affect the height of a band:
"Text";
"Rich Text";
"Picture" (with "AutoSize" property enabled);
"Table".
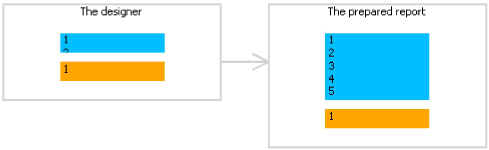
Every report object has this property. This property is accessible only in the "Properties" window. An object, whose "ShiftMode" property is enabled, will be moving up and down, if the object above on can either grow or shrink.
The "ShiftMode" property can have one of the following values:
Always (by default). Meaning that the object needs to shift always.
Never. Implies that the object does not need to shift.
WhenOverlapped. Implies that the object needs to shift in that case, if the expanding object is located exactly over it (that is, both objects overlap horizontally).
This property is convenient to use when printing information in a table form, when several cells of the table are located on top of each other and can have a variable amount of text.
Every report object has this property. When printing an object with this property, it stretches up to the bottom edge of a band:
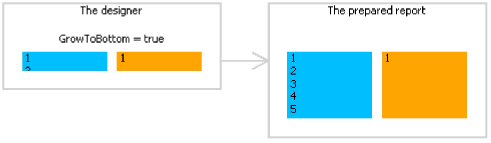
This is needed when printing information in a table form. In a table row there can be several objects which can stretch. This property makes it possible to set all objects' height to the maximum height of the band.
Every report object has this property. It determines how the object will be changing its position and/or its size when the container on which it is laying will be changing its size. By using Anchor, it can be done in such a way that, the object expands or moves synchronously with its container.
The container, being referred to, in many cases will be the band. But this is not a must - this can also be the "Table" or "Matrix" objects.
The "Anchor" property can have one of the following values, and also any combination of them:
Value |
Description |
Left |
Anchors the left edge of the object. When the container's size will be changing, the object will not be moving left/right. |
Top |
Anchors the top edge of the object .When the container's height will be changing, the object will not be moving up/down. |
Right |
Anchors the right edge of the object .When the container's width will be changing , the distance between the right edge of the object and the container will be constant. If the left edge of the container is anchored as well, then the object will be growing and shrinking synchronously with container. |
Bottom |
Anchors the bottom edge of the object. When the container's height will be changing, the distance between the bottom edge of the object and the container will be constant. If the top edge of the object is anchored as well, the object will be growing and shrinking synchronously with container. |
By default, the value of this property is Left, Top. This means that, when the container's size will be changing, the object will not be changing. In the table below, combinations of some frequent used values are given:
Value |
Description |
Left, Top |
Value by default. The object does not change when the size of the container changes. |
Left, Bottom |
The object moves up/down when the height of the container changes. The position of the object in relation to the bottom edge of the container does not change. |
Left, Top, Bottom |
When the height of the container is changing, the height of the object synchronously changes with it. |
Left, Top, Right, |
When the width and the height of the container are changing, the object grows or shrinks synchronously with it. |
Every report object has this property. This property determines on which side of the container the object will be docked.
The "Dock" property can have one of the following values:
Value |
Description |
None |
Value by default. The object is not docked. |
Left |
The object is docked to the left edge of the container. The height of the object will be equal to the height of the container*. |
Top |
The object is docked to the top edge of the container. The width of the object will be equal to the width of the container*. |
Right |
The object is docked to the right edge of the container. The height of the object will be equal to the height of the container*. |
Bottom |
The object is docked to the lower edge of the container. The width of the object will be equal to the width of the container*. |
Fill |
The object occupies all the free space of the container. |
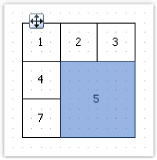
* This is not quite so, if several objects have been docked at the same time. The figure below shows two objects, the first one has been docked to the top edge of the container and the second - to the left:
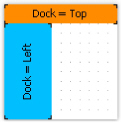
As seen, the height of the second object is equal to height of the free space, which remains after docking the first object.
The docking behavior depends on the object's creation order. You can change the order in the context menu of an object. To do this, select either the "Bring to front" or "Send to back" menu items.
In this section, we will look at the following questions:
changing an object's appearance;
changing the format of printing values;
automatically changing the appearance of an object when fulfilling some kind of condition;
hide unnecessary values;
highlighting even data rows in different colors.
Almost all report objects have the border and fill. To work with these properties, use the "Border and Fill" toolbar:
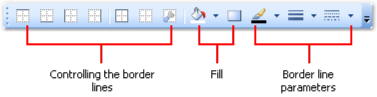
The object's border consists of four lines. Each line can have different width, color and style.
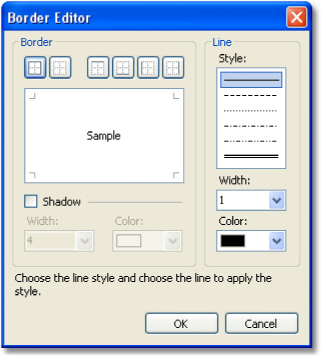
The
toolbar buttons affect all lines of frame. The ![]() button
displays a dialog which allows to set up each line separately:
button
displays a dialog which allows to set up each line separately:
To
work with fill, there are two buttons on the toolbar. The ![]() button allows
to choose a color for the solid fill type. The
button allows
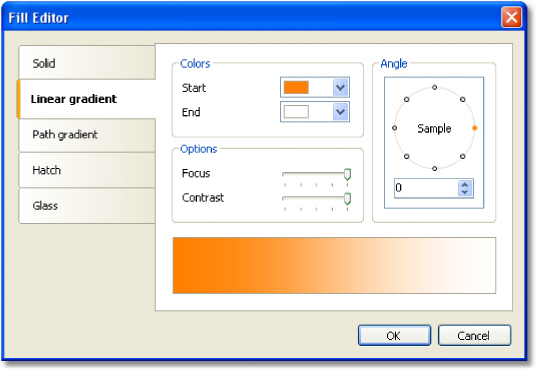
to choose a color for the solid fill type. The ![]() button displays a dialog which allows
to choose between different fill types:
button displays a dialog which allows
to choose between different fill types:
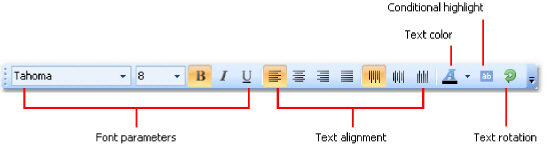
To change the "Text" object appearance, use the "Text" toolbar:
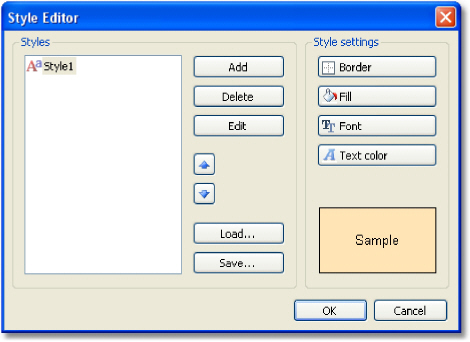
To set up the object appearance, you may use styles. Style is a set of the following
properties:
border;
fill;
font;
text color.
The
list of styles is stored in a report. You can control it either from the
"Report|Styles..." ![]() button in the "Style"
toolbar:
button in the "Style"
toolbar:
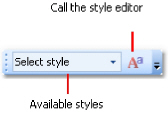
You can set an object's style in the following ways:
set the "Style" property in the "Properties" window;
use the "Style" toolbar:
If the toolbar is not present on the screen, enable it in the "View|Toolbars" menu.
When you set the object's style, the object's appearance will be changed according the style settings. When you change the style settings, the object with that style will change automatically.
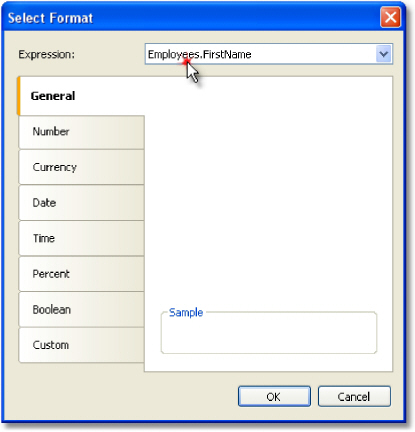
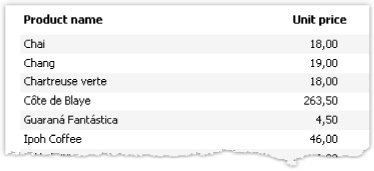
To print a textual data in a report, the "Text" object is used. It applies the default formatting to all data that comes from data source. For example, the data source columns of type "DateTime" will be printed in the following way (it depends on your system's regional settings):
11.10.2008 18:04:52
If you need to print the date part only, you have to set up the data formatting. To do this, right-click the "Text" object to show its context menu. In the menu, choose the "Format..." item. You will see the format editor window:
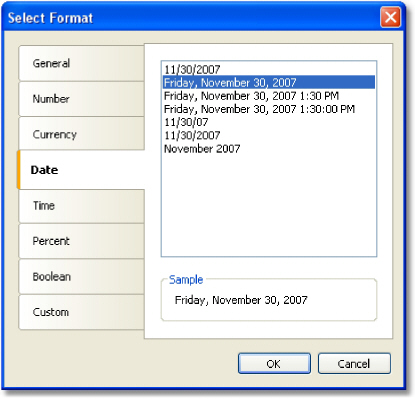
You may choose one of the available formatting types or set up own formatting string. To do this, select the "Custom" formatting. If the "Text" object contains several data columns or expressions, you may choose appropriate format for each of them. To do this, select the expression in the top of the window, then choose the format:
You may also format the data using the String.Format method. Get the help on this method in the MSDN.
Today is [String.Format("{0:d}", [Date])]
There
is an possibility to change the "Text" object's appearance depending
on the given conditions. For example, an object can be highlighted
with red color if it has a negative value. This feature is called
"conditional highlighting". To set up it, select the "Text"
object and click ![]() button
on the "Text" toolbar.You will see the following dialog window:
button
on the "Text" toolbar.You will see the following dialog window:
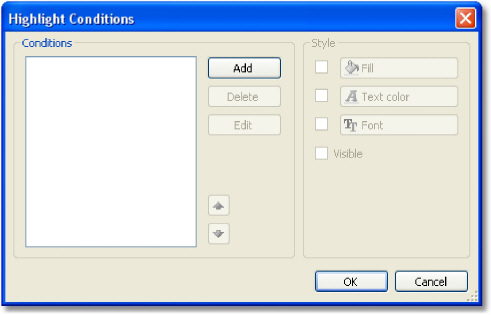
It is possible to define one or several conditions and set up the style for every condition. Style can contain one or several settings:
fill;
text color;
font;
object's visibility.
You can indicate, which settings need to be changed when the condition is met. For this, check the needed setting using the checkbox. By default, a new style contains one setting -the text color.
In order to create a new condition, click the "Add" button. You will see an expression editor:
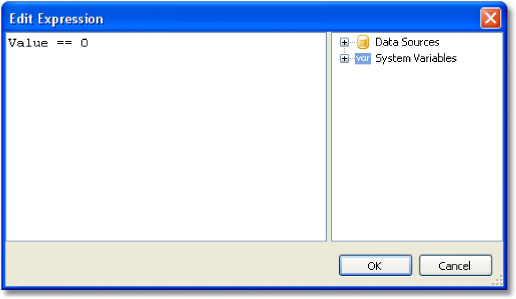
Here, it is possible to write any expression which returns a boolean result. In many cases you will use the "Value" variable, which contains the currently printing value.
Let us look at the following example: we have a "Text" object, in which we print the amount of products in stock:
[Products.UnitsInStock]
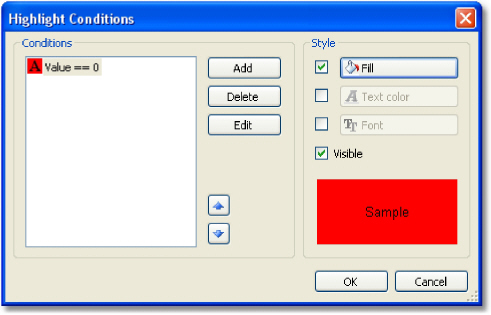
We want to paint the object red, if the amount of products = 0. For this, we create the following condition:
Value == 0
In the given case, we used the "Value" variable, which has got a printed value. If there are several expressions in an object, then this variable will have the value of the last expression. Instead of "Value", you can use a data column:
[Products.UnitsInStock] == 0
The expression is written in C# style. This is so, if the chosen report language is C#. For VisualBasic.Net you must use the single "=" sign. The report language can be changed in the "Report|Options..." menu.
Configure the style for the given condition in such a way that only fill can be used, and choose the red color:
When printing an object which has a zero value, it will be red. Let us make our example more complex, we will add another condition. If the units in stock is less than 10, it must be printed yellow. To do this, open the condition editor and click the "Add" button. The second condition will be like this:
Value < 10
In case where several conditions have been indicated, FastReport checks all the conditions, starting from the first one. If a certain condition is met, FastReport applies its style settings to the object, and the process stops. It is important to put the conditions in a correct order. The order which we have seen in this example is correct:
Value == 0
Value < 10
If we swap conditions, then the highlighting will work wrongly.
Value < 10
Value == 0
In the given case, the "Value==0" will not be executed, because when the value is zero, then
the
first condition will be met. In order to change the order of the conditions,
use the ![]()
![]()
The "Text" object has the "HideZeros" property which can be used to hide zero values. Lets look at an object with the following contents:
Total elements: [CountOfElements]
If the value of variable CountOfElements is equal to 0, and the property HideZeros is set to true, the object will be printed as follows:
Total elements:
The
"Text" object also has the "HideValue" property which
can be used to hide the value of an expression which is equal to
the given value. For example, if the property value is "0",
then all the zero fields will be hidden. This property can also be
used for hiding zero dates. As a rule,
it's a date like "1.1.0001" or "1.1.1900". In this
case the value of "HideValue" property must be like this:
1.1.1900 0:00:00
As you can see, apart from the date, you need to indicate time as well. This is necessary because the value of the date in .Net contains time also.
Important note: this mechanism depends on the regional settings of your system, which can be set in the control panel. This happens because FastReport compares strings using the "ToString()" method. This method converts an expression value into a string. In relation with this, be careful when building reports which can be launched on a computer with different regional settings.
Finally, the "NullValue" property of the "Text" object allows to print some text instead of a null value. It is often used to print the dash instead of a null value. Lets look at an object with the following contents:
Total elements: [CountOfElements]
If the value of variable CountOfElements is null, and the property NullValue is set to --, the object will be printed as follows:
Total elements: --
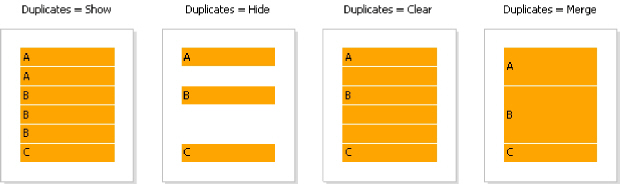
The "Text" object has "Duplicates" property which allows to control how duplicate values will be printed. This property can be used if the "Text" object is on the "Data" band. The values considered duplicate if they are printed in the near by data rows.
The "Duplicates" property can have one of the following values:
Show - show the duplicates (by default).
Hide - hide the object with duplicate value.
Clear - clear the object's text, but show the object.
Merge - merge several objects with the same value.
The difference between these modes in shown in the figure below:
In order to improve the appearance of a report, you can highlight even data rows in different colors. This can be done by using the "EvenStyle" property of the band or its objects. The property contains a style name, which will be used to highlight even band rows.
It is preferable to use the "EvenStyle" property of the object instead of the band. This avoids possible problems when exporting the report.
In order to configure the highlighting, do the following:
1.Define the style, which will be used for highlighting the rows. This can be done in the
"Report|Styles..." menu.
2.Indicate the name of the new style in the "EvenStyle" property of the band or its objects.
By default, objects use only a fill property of the style given in the "EvenStyle" property. This behavior is defined in the "EvenStylePriority" property - by default it is "UseFill". If you need to use the rest of the style parameters, set this property to "UseAll".
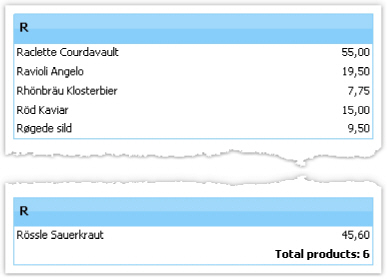
A ready report, which uses this technique, can look like this:
This type of a report is more often required. It allows printing a list of rows from the data source. For example, this can be a customer list.
Connecting a band to data source
To print a data from the data source, you will need the "Data" band, which is supposed to be connected to the data source. The band will be printed as many times as there are rows in the data source.
If the "Data" band is not connected to the source, it gets printed once.
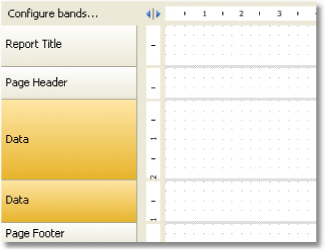
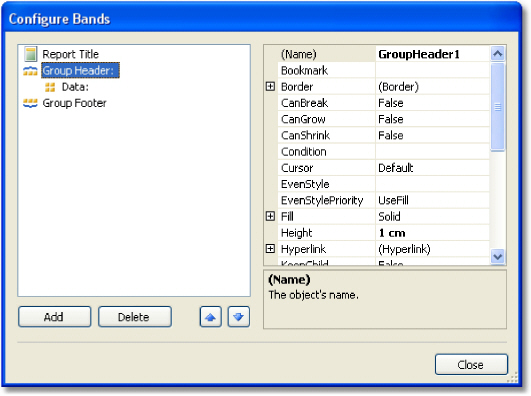
When you create a new report, it already contains several empty bands, including the "Data" band. This band can also be added into the report from the "Configure Bands" window, by choosing the "Report|Configure Bands..." menu item.
In order to connect a band to data, double click it. Choose data source in the editor window and click "OcyrillicKacyrillic":
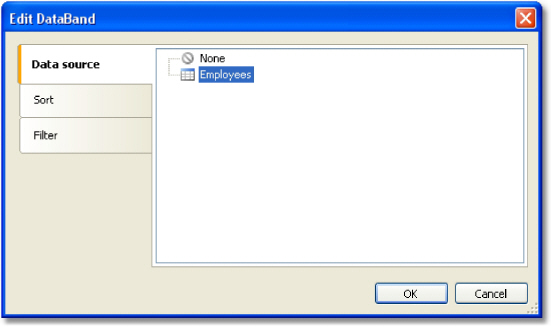
After you have connected the band to a data
source, you can place the "Text" object on the band, which
will display the information from a data column. The fastest method to
do this -drag a data column from the "Data" window and drop
it on the band. Read more about the
"Text" object in the "The
Text object" chapter.
By default, the "Data" band prints data in natural order. Often it is needed to sort the data before printing. For example, a list of customers can be comfortably presented by sorting it in an alphabetical order.
You can control sorting in the "Data" band editor. In order to call the editor, double click on a free space at the band:
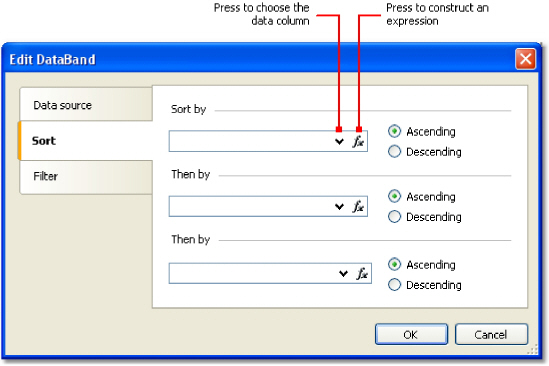
As a sort criteria, you can use either a data column or an expression. You can indicate several (not more than three) sorting conditions. This can be needed, for example, if you want to sort the list of customers by their cities, and after that, by customer's name. For each condition, you can choose the order of sorting - ascending or descending.
Another method of sorting data - use the SQL query as a data source. The query will be executed on the data server and return a sorted rows.
In order to filter a row, which is printed in the "Data" band, call its editor and switch to the "Filter" tab:
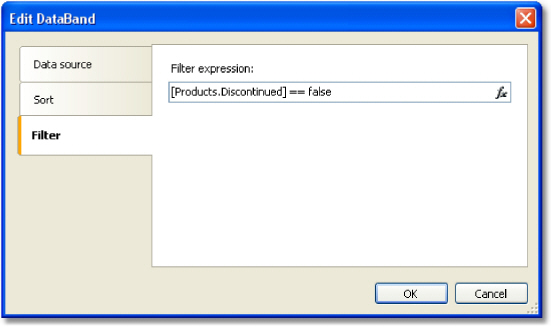
As a filter expression, you can indicate any correct expression. More details about expressions can be found in the "Expressions" chapter.
In the example above the following filter is used:
[Products.Discontinued] == false
This means that, all the data rows whose Disconnected flag is equal to false will be chosen.
You can use complex filter condition:
[Products.Discontinued] == false && [Products.UnitPrice] < 10
This means that, all the data rows whose Disconnected flag is equal to false, and whose price is less than 10 will be chosen.
This filtration method supposes that, the data source contains all rows, part of which will be filtered. If the data source contains a large amount of rows, this can seriously slow down the report. In this case you can use SQL query as a data source, in which you can perform the needed filtration. The query will be executed on the data server and return only those rows which are needed in the report.
You also may use dialogue forms to perform data filtering. See more details in the "Dialogue forms" chapter.
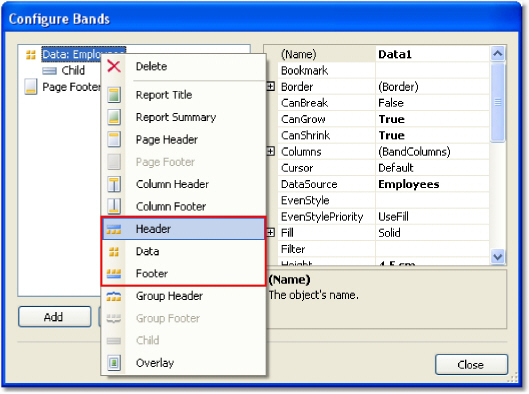
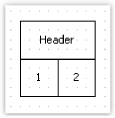
A "Data" band can contain a header and a footer. The header will be printed once before data, the footer will be printed after the output of all data.
In order to add a header and footer to a "Data" band, choose the "Report|Configure Bands..." menu item. In the widow, select the "Data" band and right click the mouse. In the context menu choose the "Header" and/or "Footer" items:
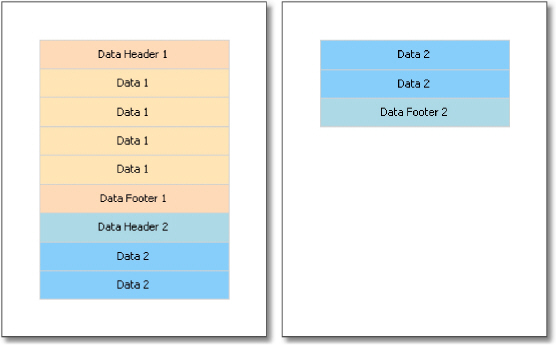
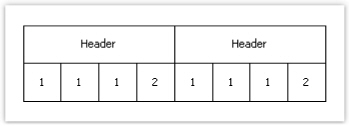
These bands can be useful in the following situations:
when printing several lists on one page ("master-master" reports). Every data band in this case can have its own header and footer:
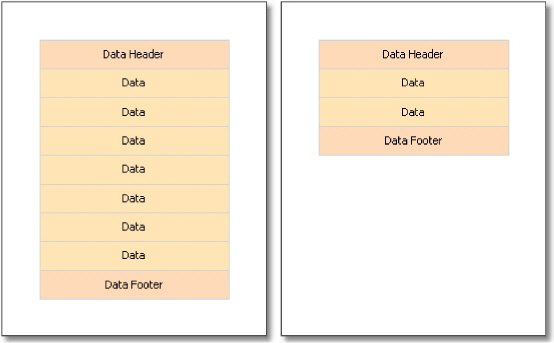
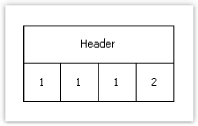
when printing one list, if the list does not fit on one page of the prepared report. By using the "Repeat On Every Page" property of the data header/footer, you can print these bands on every page of the report:
Breaking data and keeping it together
In this section, we will look at two modes of data printing - "Break" and "Keep together".
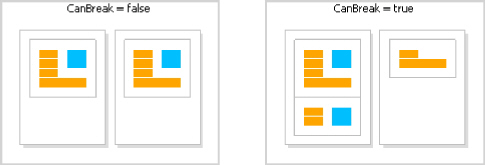
In an regular band printing mode, FastReport checks if there is enough space on the current page to print a band. If there is not, the band is printed wholly on the next page. If the "CanBreak" property of the band is enabled, FastReport will try to print the part of the band on the available space, that is, "break" it.
An attempt to break a band can be either successful or not. It depends on the type of object which has been placed on the band, and its settings. The following objects can be broken:
"Text"
"Rich Text"
"Table"
These objects have the "CanBreak" property as well. If it is enabled, then the object can be broken. Non-breakable objects are always displayed wholly, there, where they have enough place.
In the figure below, how a band can be broken is shown.
Break algorithm does not always work correctly. The artifacts can occur in a situation, when there are several objects with different font size on a band.
The goal of band breaking is to save the space on the printed sheet. Data keeping's goal is contrary: display a set of bands wholly on one sheet. In this case there will be a lot of unused space on the sheets, but the data is printed in a way that it is comfortable to percept.
The "keep together" mechanism allows keeping a set of bands together on one page (or column, if the report has columns). If, when printing, kept data reaches the end of the page, FastReport relocates all data which has been printed already onto a new page.
You can use the "keep together" in the following cases:
printing all the rows of the "Data" band together;
printing all the elements of a group (header, data, footer) together;
printing the row of the master data source together with all detail rows (in the "master-detail" report);
printing the report header or the data header together with at least one data row;
printing the report footer or data footer together with at least one data row;
printing the parent and child bands together.
Let us look at the use of "keep together" mechanism.
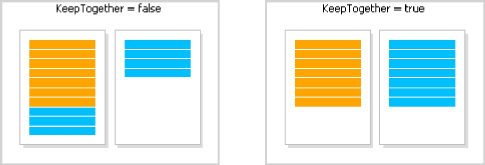
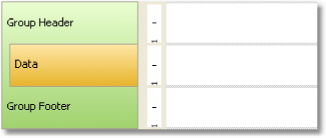
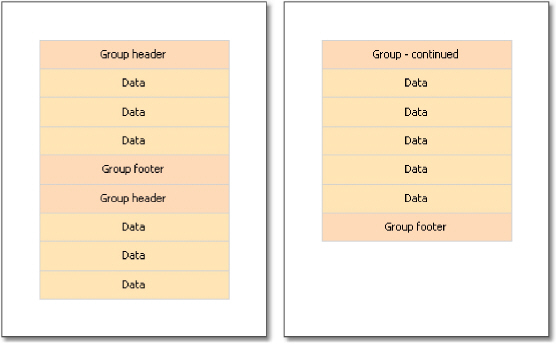
To keep together all data rows or group elements (header, data, footer), enable the "KeepTogether" property. This property is used in the "Data" and "Group Header" bands. The figure below shows how data is printed with and without keeping together:
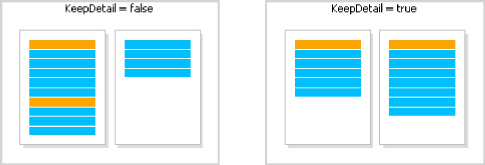
To keep master data row together with detail data rows, enable the "KeepDetail" property of the "Data" band. This property is used in a report of "master-detail" type:
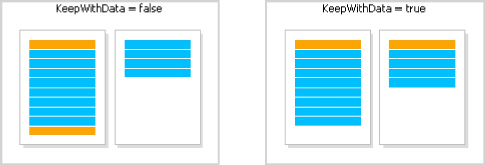
To prevent "hanging" headers and footers, use the "KeepWithData" property. The following bands have got this property:
report header;
report footer;
data header;
data footer;
group header;
group footer.
This property allows to keep header/footer with at least one data row:
In order to keep a band and its child band together, enable the "KeepChild" property.
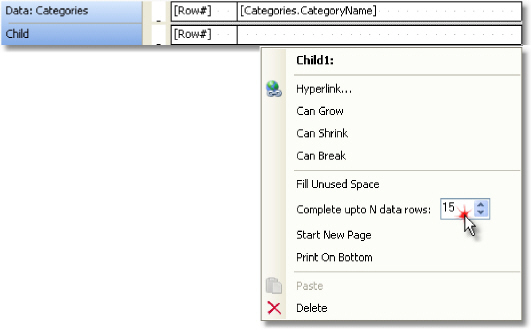
Often enough, when printing on pre-printed forms, a certain amount of data rows is supposed to be printed. If the actual data is less than needed amount of rows, then empty rows need to be printed. This can be done with the help of the "Child" band, by attaching it to the "Data" band.
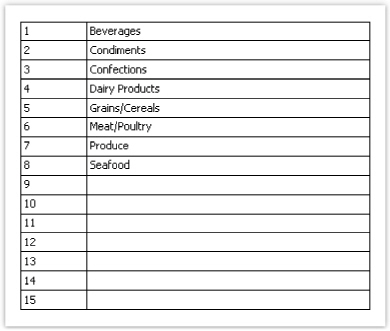
The "Child" band has got a "CompleteToNRows" property. If this property is set to value greater than 0, the band will be used for additional data rows up to the indicated amount. For example, we need to print 15 rows, but there are only 8 rows in the data source. In this case, the "Child" band will be printed 7 times.
The prepared report will look like this:
If the data source has more rows than indicated in the "CompleteToNRows" property, then an empty row will not be printed.
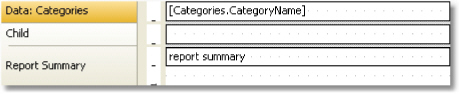
Another way to print an empty row is to fill the free space on a page. In this case, the "Child" band is attached to the bands of either the "Data Footer" or "Group Footer" types and fills the free space on the page. The footer band will be printed at the bottom of the page.
In
order to print an empty row this way, attach the "Child" band
to the footer band and enable its "FillUnusedSpace" property.
You will see that the child band is now displayed above the band
it is attached to. In the figure below, the "Child" band is
attached to the "Report
Summary" band:
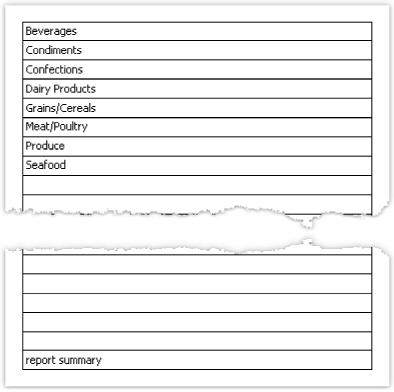
When we run such a report, we will see the following:
When the data band is connected to an empty data source, it will not be printed. Sometimes it is required to print some text like "No data" instead of just an empty page. To do this:
add a child band to the data band;
set the child band's PrintIfDatabandEmpty property to true (it can be done in the "Properties" window);
put the "Text" object on a child band and write the "No data to display" text in it.
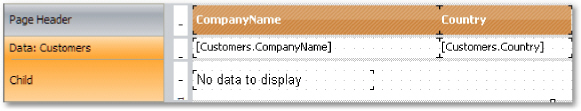
The report will be printed in the following way:
if the data source has some data rows, the data band will be printed, together with all its related bands (data header/data footer);
if the data source is empty, only the child band with "No data to display" text will be printed.
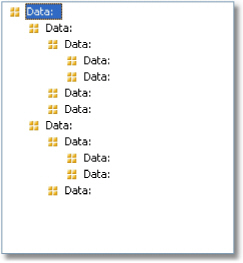
A "Data" band allows printing a hierarchical list. For this, one band and one data source are used. Hierarchy must be defined in the data source with the help of two data columns:
1.Key column. This is the data row identifier.
2.Column which contains the key of this item's parent.
In order to print such a source in a hierarchical form, you need to set the following "Data" band properties. This can be done in the "Properties" window:
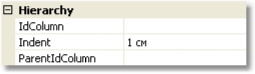
indicate the key column in the "IdColumn" property;
indicate the column containing parent value, in the "ParentIdColumn" property;
indicate the hierarchy indent in the "Indent" property.
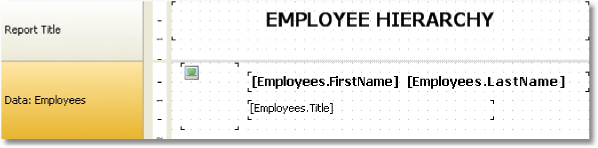
Let us look at an example of how to print a hierarchy of employees from the "Employees" demo table. The table has got two columns which we need:
EmployeeID column is the key and contains the employee ID; ReportsTo column contains the ID of "parent" employee.
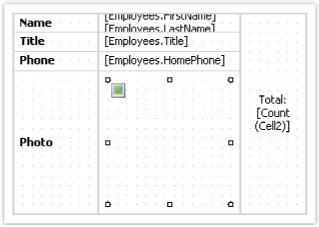
Create a report that looks like the following:
Set the "Data" band properties, which is responsible for the hierarchy, in the following way:
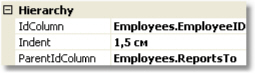
When we run a report, we will see the following:

When printing hierarchy, FastReport shifts the band to the right (by a value indicated in the Indent property), and also decreases the band width by the same value. This allows you to use the Anchor property of band's objects. Here is possible values for this property that can be used in this case:
Left, Top (by default) - the object is moved with the band;
Right, Top - the object stays in its original position;
Left, Right, Top - the right side of the object stays at its original position, the left side is moved with the band.
It allows you to get some useful effects:
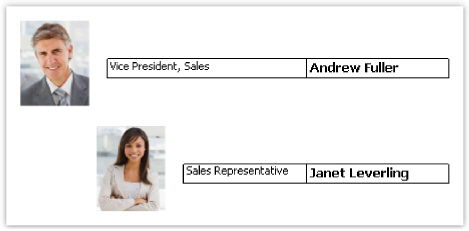
In this example, the picture object has Anchor property set to Left, Top; the object with job title is anchored to Left, Right, Top; the object with the name is anchored to Right, Top.
By using two "Data" bands, it is easy to create a report of the "master-detail" type. In this report, two data sources, between which there is a relation, are used. One row of the master source can correspond with several rows of the detail source. More details on relations can be found in the "Data" chapter.
It is necessary to place a band in a report in such a way that, the master band contains the detail band inside it. This can be done in the "Configure bands" window, which can be called in the "Report|Configure Bands..." menu.
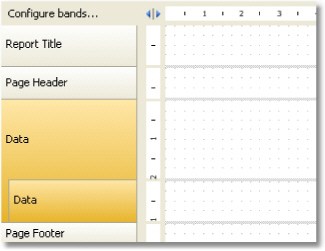
Let us look at the creation of a master-detail report from a scratch. For this, we will run the report designer and create a new empty report. It already contains one "Data" band:
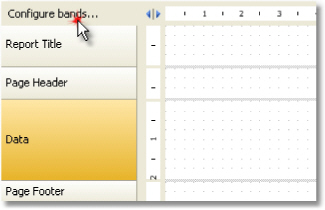
In order to add a detail data band, call the "Configure Bands" window. This can be done by pressing the "Configure bands..." button, shown in the figure, or by choosing the "Report| Configure Bands..." menu item. In the configurations window, the band structure is displayed:
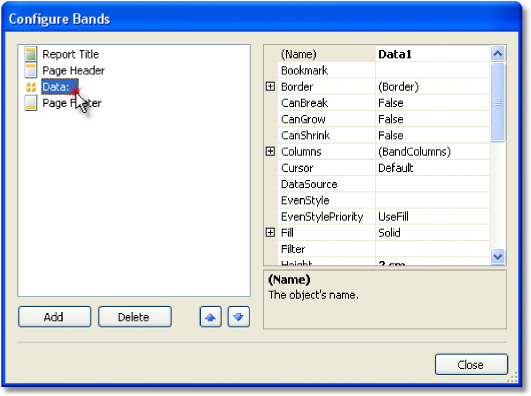
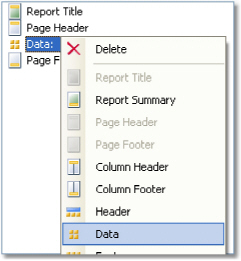
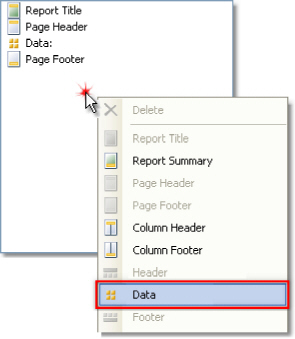
Select the "Data" band, as shown in the figure, and right click the mouse in order to show the context menu (or press the "Add" button in the lower part of the window). In the window which will open, select "Data" band:
After this, a nested "Data" is added to the selected band. Close the window by pressing the "Close" button. You will see that the report template changes in the following way:
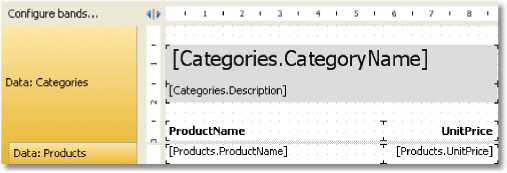
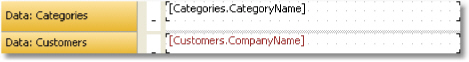
Nested data bands are clearly seen on band structures on the left part of the window. After this, you need to connect the band to the corresponding data source and place data columns on the bands. We will be using two data sources - Categories and Products - from the demo data base which comes with FastReport:
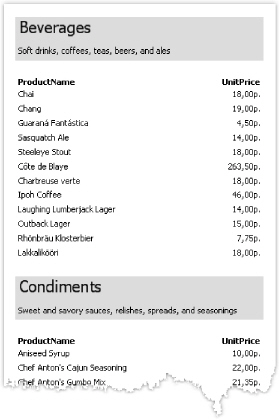
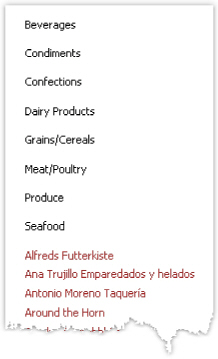
If we run the report, we will see the following:
In this way, you can create a master-detail report type with unlimited nested data, for example, master-detail-subdetail. Another method, which is used for the creation of master-detail report type, connected with the use of nested reports. Nested reports will be looked at in the "Subreports" section.
On the report page, you can print several simple lists. This can be done, by placing on the page two or several "Data" bands. Contrary to master-detail report, where bands are nested into each other and prints data from related sources, in a report of this type both bands and data sources do not depend on each other.
We will show by an example, how to create a report which prints two lists on a page -Categories table and Customers table. We will create a new report and add into it needed data sources. In order to add a second "Data" band, call the "Configure Bands" window.
Right click on an empty place of the list, as shown in the figure, and select "Data" band in the context menu. This creates a new independent "Data" band. The report template will be like this:
Now, we will connect the band to the data source and place several data columns on it:
If we run the report, we will see the following:
A "Data" band can contain one or several nested "Data" bands. This allows building a master-detail-detail report type. To do this, call the "Configure Bands" window, right click on the master "Data" band and add a detail "Data" band to it. Repeat this procedure in order to add the second detail band:
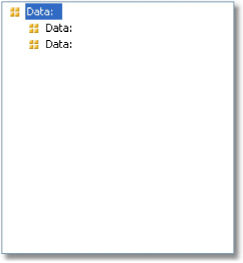
In this way, it is possible to add an unlimited number of detail bands to the master "Data" band. An example report structure can be like this (this is just an example; it only demonstrates the abilities of FastReport):
An ordinary report prints data as long as it has not reached the end of the page. After this, a new page is formed and printing continues on it. A report with columns prints data in several columns. When the end of the page has been reached, printing continues in a new column on the same page. In this sense, an ordinary report can be seen as a report with one column.
In FastReport there are two methods of printing columns.
The first method is based on setting the number of columns of the report page. This is done in the "Page Setup" window on the "Columns" tab:
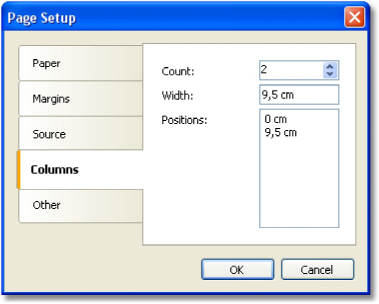
As seen, you can set the following column parameters:
column count;
column width;
the position of every column.
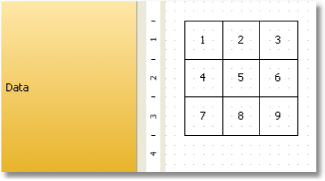
In order to transform an ordinary report into a report with columns, you need to set only the number of columns on the page. The rest of the parameters FastReport will calculate on its own. When you enable columns, the mode of bands in the designer changes:
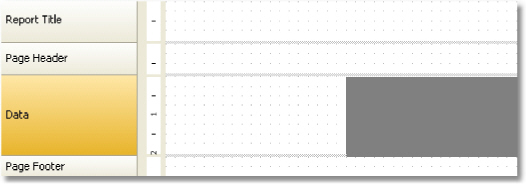
The area shown in grey should never be used for placing objects on it. It is used to print next columns' objects.
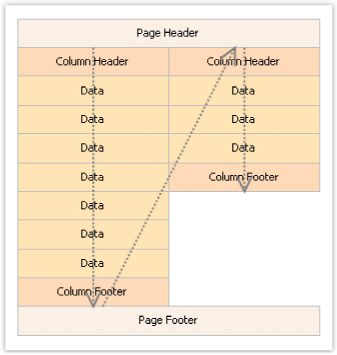
For working with columns, the "Column Header" and "Column Footer" bands are used. As seen from their names, they print at the top and the bottom of every column respectively. The following figure demonstrates the bands printing order in the report with columns:
Another method of printing a multicolumn report is based on using the "Data" band columns. The rest of the bands continue to be printed in one column.
Column parameters can be configured using the "Columns" property, which can be changed in the "Properties" window. You can set up the following parameters:
number of columns;
column width;
column printing mode. You can select either of the two modes - "AcrossThenDown" and "DownThenAcross";
the minimum number of rows in one column, if the chosen mode is "DownThenAcross".
Column band can be printed in either of the two modes. In the "AcrossThenDown" mode (the default one), columns are printed in the following way:
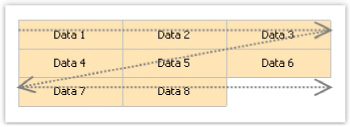
In the "DownThenAcross" mode, column printing occurs in the following way:
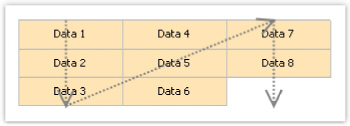
In this mode, FastReport calculates the number of data rows in a column in such a way that, columns are filled equally. You can also set the minimum number of rows in a column with the "Columns.MinRowCount" property.
When printing a report in form of a booklet, you will probably face with the following demands:
separate report page - cover, table of contents, report contents, back cover;
different page margins for even and odd pages;
different header and footer on even and odd pages.
You
can add any number of pages into the report template. On each page you
can place a separate
report. To add a new page, click the ![]() button
on the toolbar. A page can also be added,
by pressing the "Add New..." button and selecting the "Report
page" item in the window.
button
on the toolbar. A page can also be added,
by pressing the "Add New..." button and selecting the "Report
page" item in the window.
For creating the "Table of Contents" section, you can use the technique described in the "Interactive reports" chapter.
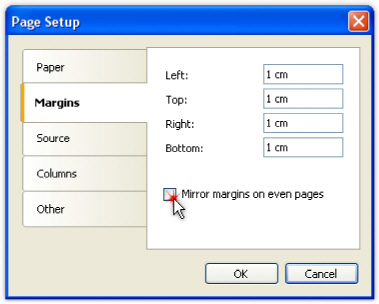
In the "Page Setup" window, you can indicate that FastReport should mirror the left and the right margin for even pages:
If you need to start the page on an odd page number, set the "StartOnOddPage" property to true. When needed, FastReport prints the empty page before starting to print the indicated page.
All report objects have the "PrintOn" property. Using this property, you can print different objects on odd and even pages.
This property can be set in the "Properties" window.
This property determines on which pages the object can be printed. The property can have one of the following values or any combination of it:
FirstPage;
LastPage - the report must be double-pass;
OddPages;
EvenPages;
RepeatedBand. This value refers to a band with the "RepeatOnEveryPage" property set to true;
SinglePage - the report must be double-pass.
By default, the value of this property equals to "FirstPage, LastPage, OddPages, EvenPages, RepeatedBand, SinglePage". This means that the object will be printed on all pages of the report. In case the report has single page only, the object's visibility is determined by the SinglePage value only.
We will give several typical examples of using this property:
Property value |
Where the object will be printed |
FirstPage |
Only on the first page. |
LastPage, OddPages, |
On all pages except the first. |
FirstPage, OddPages, |
On all pages except the last. |
RepeatedBand |
Only on bands with the "RepeatOnEveryPage" property is set to true. |
FirstPage, LastPage, |
On all bands except the repeated one. |
FirstPage, LastPage, |
Only on odd pages. |
FirstPage, LastPage, |
Only on even pages. |
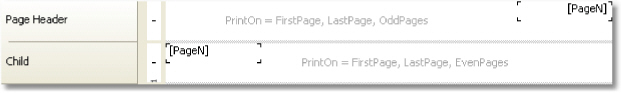
For example, to print different text on odd and even pages, put two "Text" objects on a band and setup them in the following way:
the first object will be printed on odd pages. Set its "PrintOn" property to "FirstPage, LastPage, OddPages, RepeatedBand" (i.e. all values except "EvenPages").
the second object will be printed on even pages. Set its "PrintOn" property to "FirstPage, LastPage, EvenPages, RepeatedBand" (i.e. all values except "OddPages").
These objects will never be printed at the same time. You could place them on top of each other.
All bands have the same property. To print different bands on odd and even pages, use the "Child" band. You can attach it to any band; this can be done in the "Configure Bands" window. Setup the main band and its child in the following way:
the main band will be printed on odd pages. Set its "PrintOn" property to "FirstPage, LastPage, OddPages, RepeatedBand" (i.e. all values except "EvenPages").
the child band will be printed on even pages. Set its "PrintOn" property to "FirstPage, LastPage, EvenPages, RepeatedBand" (i.e. all values except "OddPages").
Bands can have different height, appearance and contents. Look at the following example which prints different page headers:
Earlier we looked at the "Master-detail" report type, which printed data from two related sources. FastReport allows creating a report which looks in the same way, but uses one data source. For this, groups are used.
A group is a set of three bands: "Group header", "Data" and "Group footer". In designer, this looks as follows:
A group always contains a header and data. Group footer is optional, you can delete it.
In order to use a group, you should set the group condition for the group header, and connect the data source to the "Data" band. The condition can be any expression, but as a rule, this is one of the data source columns. Group printing is done in the following way:
1.group header is printed.
2.data row is printed.
3.checks if the grouping condition has changed.
4.if the condition has not changed, next data row is printed (p.2).
5.if the condition has changed, the group footer is printed, and starts printing a new group
(p.1).
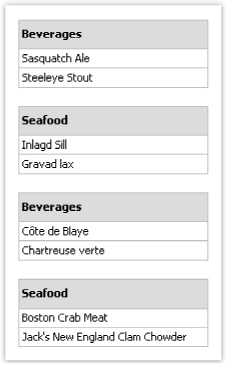
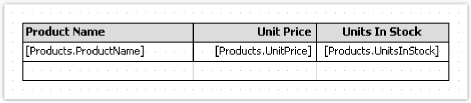
Assuming that we have a Products table with the following data:
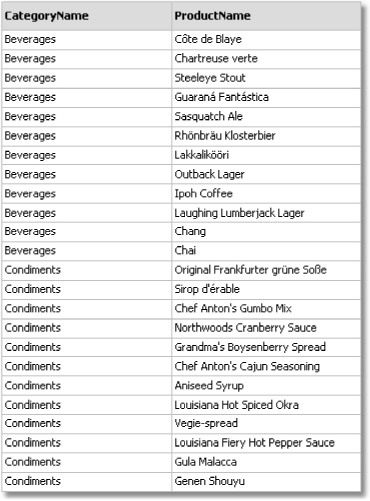
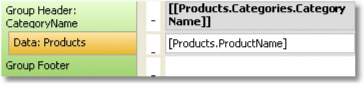
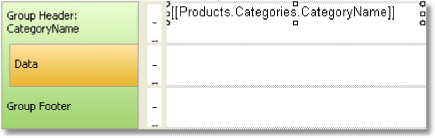
Data can be grouped on the CategoryName column. This column will be printed in the group header. The data itself is presented by the ProductName field. The report will be as follows:
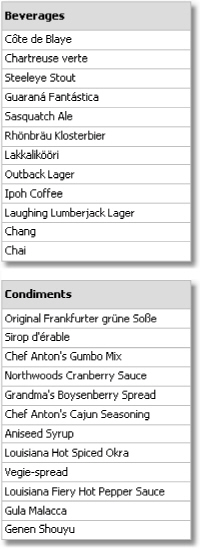
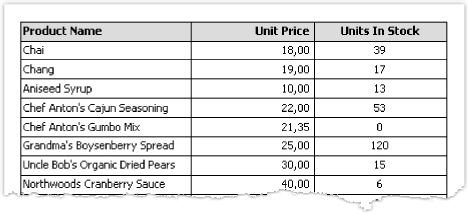
If we run the report, the following will be seen:
Adding a group into a report can be done by using two methods.
First method: you add the "Group header" band in the "Configure Bands" window. To do this, press the "Add" button and select the "Group header" band. FastReport adds the group to the available "Data" band or will create a whole group, if such a band is not in the report:
In order to configure a group, double click the "Group header" band. You will see the group header editor window:
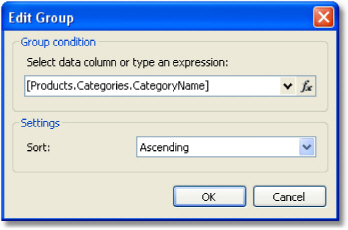
You need to set the group condition. This can be any expression or data source column. Also choose the sorting. By default, data is sorted in ascending order.
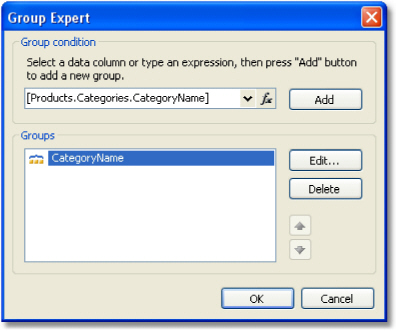
Second method: you use the wizard, which can be called from the "Report|Group Expert..." menu. In order to create a group, enter the group condition and press the "Add" button:
The wizard will add all the elements of the group into the report. Also it creates the "Text" object on the group header, in which the group condition is printed:
For correct working of the group, it is needed to fulfill the following condition: data source must be sorted on that column which is used in the group condition. If this condition is not fulfilled, you will see a lot of groups containing 1-2 data rows:
Fortunately, there is a possibility of sorting the data source in two ways.
you can set up the data sorting in the group editor. Data source will be automatically sorted on group condition;
you can set up the sorting in the "Data" band editor.
Both methods are equivalent, however it is comfortable to use the first method. When creating groups, you set up the data grouping and sorting in one dialog.
In certain situations, the first method should not be used. Assuming that, we will set grouping on the first letter of the product's name. In such case, the product will be sorted only on the first letter, which is not acceptable. You should use the second method and indicate sorting on the full name of the product.
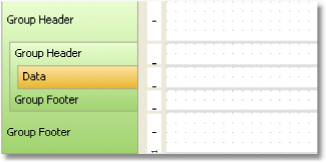
A nested group has several "Group header" bands. The last band contains the "Data" band:
Every group header has its own group condition.
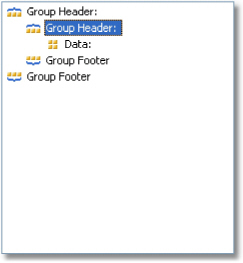
Creating a nested group can be done in the same way like an ordinary. In the first case, you create a simple group and add the nested group in the "Configure Bands" window. For this, select the existing "Group header" band, press the "Add" button and add another "Group header" band:
After this, call the editor of the added group and set up the group condition.
In the second case, you use the group expert which we have looked at already. Set the grouping condition and click the "Add" button. The wizard will add the new group to the existing one.
Printing of the nested group does not differ much from printing of an ordinary group. When printing data, FastReport will check all group conditions of all groups. If the condition changes, the corresponding group finishes and a new group starts printing.
For managing groups, the group expert can be used. It can be called from the "Report|Group Expert..." menu:
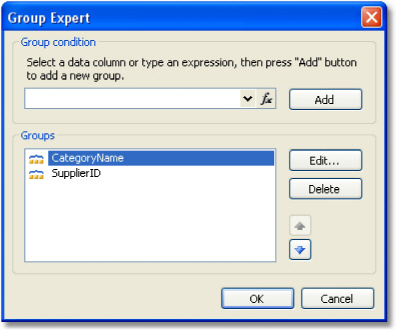
With the help of the wizard you can either add or delete a group, and change the grouping
order
as well. For changing the grouping order, the buttons![]() and
and![]() are used.
With the help of
the "Edit..." button, you can change the group condition of
the chosen group.
are used.
With the help of
the "Edit..." button, you can change the group condition of
the chosen group.
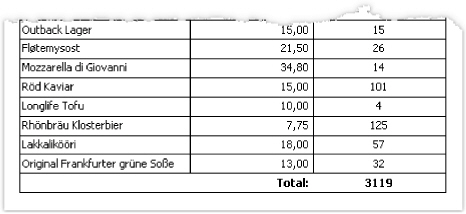
Grouping is often used for printing some total values in every group. For example, this can be the number of rows in the group, or sum from one of the data columns. For printing such values, the total is used. The use of totals is described in the "Data" chapter.
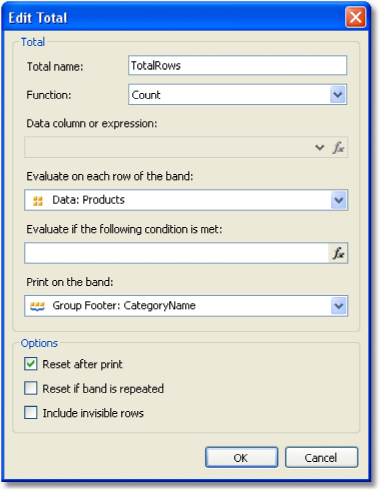
In order to print the total value in the group, you need to do the following:
create a total, by selecting the "Actions|New total..." item in the "Data" window;
choose the group's data band in the "Evaluate on each row of the band" combobox;
choose the group footer in the "Print on the band" combobox;
place the "Text" object, which prints the total value, on the group footer.
For example, for printing the number of rows in every group, configure the total as follows:
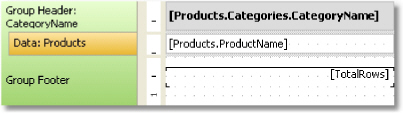
In order to display the value of the total, drag it onto the group footer:
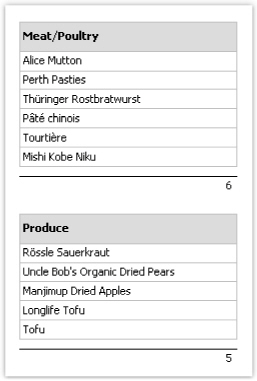
Prepared report will be like this:
Repeating the header and footer
Group header and footer have the "RepeatOnEveryPage"
property. It can be useful if the group does not fit on one page
of a prepared report. By using this property, you can print the group header/footer
on each page, where the group is printed. When printing such header/footer, FastReport
sets its "Repeated" flag. This can be used for printing different
objects on an ordinary group header and on repeat, for example, printing
the "continue..." text on a new page. For this, use the
"PrintOn" property of the "Text" object (see more
details in the
"Booklet" report type"
section).
In order to print different texts, place two objects on the group header, one on top of the
other:
the first object will be printed on ordinary headers. Set its "PrintOn" property value to "FirstPage, LastPage, OddPages, EvenPages" (that is all values except the "RepeatedBand");
the second object will be printed only on the headers which are repeated. Set its "PrintOn" property to "RepeatedBand". Add the "Text" object with "continue..." text on the header.
The report will be printed as follows:
Group footer can also be repeated on every page:
In
this report, the group footer has two objects, placed one on top of the
other: 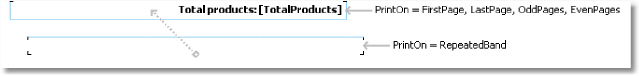
The "Group Header" band has some useful properties.
The "StartNewPage" property allows forming a new page before printing the group. As a result, each group will be placed on a new page.
The new page will not be added before the first group. This is done in order to avoid an empty first page.
The "ResetPageNumber" property allows resetting the page number when printing the group. Usually it is used together with the "StartNewPage" property. As a result, if both of these properties are enabled, every group will be printed on a new page, and will have its own page numeration.
Sometimes
at a certain place of the main report, extra data needs to be shown, this
can be a separate report with a very complicated structure. You can
try to solve this task by using FastReport's rich collection of bands.
However, in certain cases, it is preferable to use the
"Subreport" object.
The "Subreport" object is an ordinary report object, which can be placed on one of the bands. When you do this, FastReport adds an extra page into the report and connects it with the subreport. On this page it is possible to create an extra report, having any structure.
When printing the report, in which there is the "Subreport" object, the following will be done:
1.The
main report will be printed, while the "Subreport" object is
not met;
2.The subreport bands will be printed;
3.Printing of the main report will continue.
Since subreport is formed on the sheet of the main report, it cannot contain the following bands: "Report header/footer", "Page header/footer", "Column header/footer", "Overlay".
Subreport can be printed in two modes.
In the first printing mode, bands and objects of the subreport are printed on the page of the main report. There are some limitations:
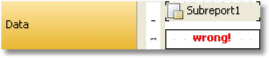
"Subreport" object must be located in lower border of the band;
Never place other objects under the "Subreport" object. When the report will be working, such objects will be overlapping with the objects of the subreport:
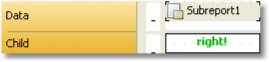
To place other objects under the subreport, use the "Child" band. Place the objects in the following way:
The second printing mode differs in that subreport's objects are printed on the band, which contains the "Subreport" object. You can enable this mode from the context menu of the "Subreport" object. To do this, select the "Print on Parent" item. This mode does not put a limit on placing of the objects. Apart from that, in this mode, a parent band can either grow or shrink depending on how much data has been printed in the subreport.
The only problem with the second mode is that there may be a lot of data in the subreport. When printing it, the parent band will have a big height. In order to print such a band correctly, it is required to break its contents ("CanBreak" property). The break algorithm does not provide 100% quality and in some cases it can lead to the displacement of objects.
By placing two "Subreport" objects side-by-side on the same band, you can print two independent data lists. When printing such a report, FastReport acts in the following way:
prints the main report until, the "Subreport" object is not met;
prints the first subreport;
turn to the page where the printing of subreport started from, and prints the following subreport;
after all the subreports have been printed, the main report continues to be printed from where the longest subreport has stopped.
On the page of a subreport, you can place another "Subreport" object, so the subreport becomes nested. The number of nesting levels formally is not restricted; however do not get carried away by that. Multiple nesting is very difficult to understand. If you have the possibility, use data bands for printing nested data. A "Data" band can have one or several nested "Data" bands. If you need to print a report of the master-detail type or master-detail-subdetail, there is no need to use the subreport.
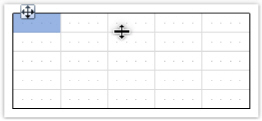
The "Table" object is made up of rows, columns and cells. It is a simplified analog of Microsoft Excel table. It looks in the following way:
You can add or delete columns with the help of the context menu. For that:
select the table or any of its elements and place the cursor on the needed column. The cursor's form changes to a small black arrow.
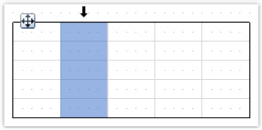
left click, in order to select the column;
right click in order to show the column's context menu;
if you need to select several adjacent columns, left click and, without leaving it, move the mouse to the right or to the left, in order to select adjacent columns.
Column's context menu can also be called in the "Report Tree" window. Open the window, select the needed column and right click the mouse.
Managing the size of the column
You can set up the width of the column by using one of the following methods:
select the table or any of its elements and place the cursor on the border between two columns. The form of a cursor changes into a horizontal splitter:
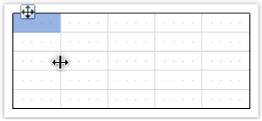
select a column and indicate the needed width in the "Width" properties. This property is accessible in the "Properties" window.
You can also enable the "AutoSize" column property. When running the report, the width of the column will be calculated automatically. In order to limit the width of the column, you can indicate the "MinWidth" and "MaxWidth" properties.
Width of the column should never be larger than the page's width.
Rows are configured in the same way. In order to select a row, do the following:
select the table or any of its elements and place the cursor to the left of the needed row. The cursor's form changes to a small black arrow:
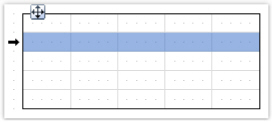
left click the mouse, in order to select the row;
right click the mouse in order to show the row's context menu.
If you need to select several adjacent rows, then left click the mouse and, without leaving it, move the mouse to right or to the left, so as to select the adjacent rows.
You can set up the height of the row by using one of the following methods:
select the table or any of its elements and place the cursor on the border between two rows. The cursor's form changes into a vertical splitter:
Left click and move the mouse, in order to change the size of the row.
select the row and indicate the needed height in the "Height" property. This property is accessible in the "Properties" windows.
You can also enable the row's "AutoSize" property. When the report is run, the height of the row will be calculated automatically. In order to limit the height of the row, you can use the minimum height ("MinHeight") and Maximum height ("MaxHeight") properties:
Height of the row should never be larger than the page's height.
Cells are text objects. In essence, the cells class is inherited from the "Text" object.
Everything which has been said above about the "Text" object applies to the table's cells as well.
Editing the cells' text can be done just like the "Text" object. Besides, you can drag and drop an element from the "Data" window into the cells.
Border and fill of a cell can be configured with the help of the "Border and Fill" toolbar.
In order to call a cell's context menu, just right click on the cell.
You can join adjacent cells of the table. As a result, there will be one big cell. In order to do this:
select the first cell with the help of a mouse;
left click and, without leaving it, move the mouse in order to select the group of cells;
on the selected region, right click the mouse in order to show the context menu of the cells;
in the context menu, choose the "Join cells" item.
In order to split a cell, call its context menu and choose the "Split cell" item.
In the cells, you can insert other objects, for example, the picture. The following objects can never be added into the cells:
"Table";
"Matrix";
"Subreport".
In order to add an object into the cell, simply drag it inside the cell. You can freely move an object between cells, and also take it back beyond the table's boundary.
A cell serves as a container to objects placed into it. This means that, you can use the "Dock" and "Anchor" properties of an object inside the cell. This allows changing the size of the object when the size of the cell is changing.
A table can be printed in two modes:
In the first mode, the table is printed inside the band which it belongs to, and looks just the same as in the designer. In this mode, the table does not split across pages if its width is bigger than the width of the report page. This is the mode of printing by default.
The second mode is dynamic. In this mode, the table is built with the help of script. During this, the resulting table can be different from the initial table, just like the prepared report of FastReport differs from the report template. In dynamic mode, the table can split across pages if it does not fit on the report page.
In the dynamic mode, the table does not get printed on the band on which it was placed. Instead of this, the table itself generates a set of bands, which contain parts of the resulting table. This mode of work imposes the following limits:
never put other objects under the table or near it. Instead of this, use the "Child" band;
never put two "Table "objects on one band.
Let us look at the dynamic mode in details.
This mode is connected with programming and needs higher qualifications from the report developer.
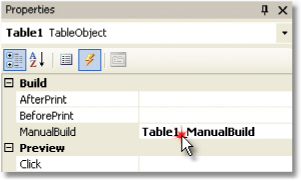
Formation of the table is done with the help of script. In order to create a script, select the "Table" object, in the "Properties" window click the "Events" button and double click on ManualBuild event:
When this is done, an empty event handler is added into the report code:
private void Table1_ManualBuild(object sender, EventArgs e)
{
}
In this mode, the source table is used as a template. In the event code, you can print rows and columns from the source table as many times as it is needed. During this, the resulting table will be formed, which can contain an unlimited number of rows and columns. Such a table can split across pages if it does not fit on the report page.
For printing a table, the following methods of the "Table" object are used:
Method |
Parameters |
Description |
PrintRow |
int index |
Prints the row with the specified index.
Row numbering |
PrintColumn |
int index |
Prints the column with the specified index.
Column |
PrintRows |
int[] indices |
Prints several rows of the table. |
PrintRows |
- |
Prints all rows of the table. |
PrintColumns |
int[] indices |
Prints several columns of the table. |
PrintColumns |
- |
Prints all columns of the table. |
PageBreak |
- |
Inserts a page break before printing the
next column or |
Printing a table can be done by using one of the following methods:
The first method - printing from top to bottom, then from left to right. This method fits better a table with a variable amount of rows. You must call the methods in the following order:
PrintRow(row index);
one or more calls of the PrintColumn(column index) or PrintColumns(columns indices) methods for printing the indicated columns;
or one call of the PrintColumns() method for printing all columns;
repeat this sequence in order to print all the needed rows of the table.
Every row of the table must contain the same number of columns. Keep it in mind, when using the PrintColumn(int index) and PrintColumns(int [] indices) methods.
The second method - printing from left to right, then from top to bottom. This method is better for printing a table with a variable number of columns. You must call the methods in the following sequence:
PrintColumn(column index);
one or several calls of the PrintRow(row number) or PrintRows(rows indices) for printing the indicated rows;
or one call of the PrintRows() method for printing all rows;
repeat this sequence in order to print all the needed columns of the table.
Every column of the table must contain the same number of rows. Keep it in mind, when using the PrintRow(int index) and PrintRows(int [] indices) methods.
Violation of the order of calling the printing methods leads to errors when executing the report. One of the errors - attempting to print the table with the help of the following code:
Table1.PrintRows();
Table1.PrintColumns();
This sequence of methods is not correct. You must start printing the table with either the PrintRow or PrintColumn method.
Here we are talking about headers which contain spanned cells. When printing rows or columns of the table, which has got spanned cells, the cells automatically increase in size. We will show this in the next example:
We will create a ManualBuild event handler, which will be printing the first column 3 times and the second column 1 time:
private void Table1_ManualBuild(object sender, EventArgs e)
{
// printing row 1 and columns 0, 0, 0, 1
Table1.PrintRow(0);
Table1.PrintColumn(0);
Table1.PrintColumn(0);
Table1.PrintColumn(0);
Table1.PrintColumn(1);
// printing row 1 and columns 0, 0, 0, 1
Table1.PrintRow(1);
Table1.PrintColumn(0);
Table1.PrintColumn(0);
Table1.PrintColumn(0);
Table1.PrintColumn(1);
}
Pay attention that we have printed the same number of columns in every row. If this rule is violated, then we will get an unpredictable result.
As a result of executing this code, we will get the following:
As seen, the header cell is spanned automatically. We will make the code a little more complex, so that two groups of columns can be printed:
private void Table1_ManualBuild(object sender, EventArgs e)
{
// print 0 row and two groups of 0, 0, 0, 1 columns
Table1.PrintRow(0);
// group 1
Table1.PrintColumn(0);
Table1.PrintColumn(0);
Table1.PrintColumn(0);
Table1.PrintColumn(1);
// group 2
Table1.PrintColumn(0);
Table1.PrintColumn(0);
Table1.PrintColumn(0);
Table1.PrintColumn(1);
// print 1 row and two groups of 0, 0, 0, 1 columns
Table1.PrintRow(1);
// group 1
Table1.PrintColumn(0);
Table1.PrintColumn(0);
Table1.PrintColumn(0);
Table1.PrintColumn(1);
// group 2
Table1.PrintColumn(0);
Table1.PrintColumn(0);
Table1.PrintColumn(0);
Table1.PrintColumn(1);
}
When we run the report, we will see the following result:
When printing the second column with the following code:
Table1.PrintColumn(1);
the header is finished and further printing of the first column starts a new header:
// group 2
Table1.PrintColumn(0);
In the dynamic mode of the "Table" object, the following total functions are supported:
Function |
Parameters |
Description |
|
Sum |
TableCell cell |
Returns the sum of the values contained in cell. |
|
Min |
TableCell cell |
Returns the minimum from the values contained in a cell. |
|
Max |
TableCell cell |
Returns the maximum from the values contained in a cell. |
|
Avg |
TableCell cell |
Returns the average of the values contained in a cell. |
|
Count |
TableCell cell |
Returns the number of rows, contained the specified cell. |
|
In an ordinary printing mode (not dynamic) these functions will not work. |
|
||
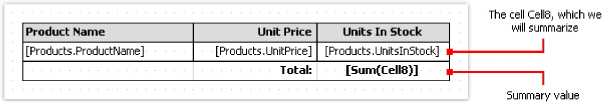
In order to use the total function, place it in the cell of the table. For example, the following function calculates the sum of the values contained in a cell named "Cell1":
[Sum(Cell1)]
During this, all the cells located higher and on the left of the current cell (in which we are calculating the sum) are analyzed.
The table which is built dynamically, can be automatically split across pages. This behavior is controlled by the "Layout" property of the table. You can choose one of the following values:
Value |
Description |
AcrossThenDown |
Table is rendered across then down. |
DownThenAcross |
Table is rendered down then across. |
Wrapped |
Wide table is wrapped and rendered on the same page. |
Let us look at printing tables for example. As a template, we will use the following report:
To start, select the table and create an event handler for "ManualBuild" event.
Example 1. Printing the whole table from top to bottom
private void Table1_ManualBuild(object sender, EventArgs e)
{
// printing row 0 and all of its columns
Table1.PrintRow(0);
Table1.PrintColumns();
// printing row 1 and all of its columns
Table1.PrintRow(1);
Table1.PrintColumns();
// Printing row 2 and all of its columns
Table1.PrintRow(2);
Table1.PrintColumns();
}
As a result, the following table will be printed, which does not differ from the template:

Example 2. Printing the table from top to bottom with a repeating row
private void Table1_ManualBuild(object sender, EventArgs e)
{
// Printing row 0 and all of its columns
Table1.PrintRow(0);
Table1.PrintColumns();
// Printing 3 copies of row 1 and all of its
columns
for
(int
i = 0; i < 3; i++)
{
Table1.PrintRow(1);
Table1.PrintColumns();
}
// printing row 2 and all of its columns
Table1.PrintRow(2);
Table1.PrintColumns();
}
In this example, the middle row gets printed 3 times. As a result, we get the following:
Example 3. Printing the whole table from left to right
private void Table1_ManualBuild(object sender, EventArgs e)
{
// printing column 0 and all of its rows
Table1.PrintColumn(0);
Table1.PrintRows();
// printing column 1 and all of its rows
Table1.PrintColumn(1);
Table1.PrintRows();
// printing column 2 and all of its rows
Table1.PrintColumn(2);
Table1.PrintRows();
}
As a result, the following table will be printed, which does not differ from the template:
Example 4. Printing a table from left to right with a repeating column
private void Table1_ManualBuild(object sender, EventArgs e)
{
// printing column 0 and all of its rows
Table1.PrintColumn(0);
Table1.PrintRows();
//
printing 3 copies of column 1 and all of its rows
for
(int
i = 0; i < 3; i++)
{
Table1.PrintColumn(1);
Table1.PrintRows();
}
// printing column 2 and all of its rows
Table1.PrintColumn(2);
Table1.PrintRows();
}
In this example, the middle column of the table gets printed 3 times. As a result, we get the following:
Example 5. Printing a table with repeating rows and columns
private void Table1_ManualBuild(object sender, EventArgs e)
{
// --------- printing row 0
Table1.PrintRow(0);
// printing column 0
Table1.PrintColumn(0);
// printing 3 copies of column 1
for (int i = 0; i < 3; i++)
Table1.PrintColumn(1);
// printing column 2
Table1.PrintColumn(2);
// --------- printing 3 copies of row 1
for (int j = 0; j < 3; j++)
{
Table1.PrintRow(1);
// printing column 0
Table1.PrintColumn(0);
// printing 3 copies of column 1
for (int i = 0; i < 3; i++)
Table1.PrintColumn(1);
// printing column 2
Table1.PrintColumn(2);
}
// --------- printing row 2
Table1.PrintRow(2);
// printing column 0
Table1.PrintColumn(0);
// printing 3 copies of column 1
for (int i = 0; i < 3; i++)
Table1.PrintColumn(1);
// printing column 2
Table1.PrintColumn(2);
}
Pay attention that we printed the same number of columns in every row. If this rule is violated, then we will get an unpredictable result.
In this example, the middle row and middle column of the table were printed 3 times. And as a result, we get the following:
Example 6. Using the data source
In all the examples considered, we printed a table, which contains an ordinary text. In this example we will show how to form a table using data source. For this, we will create a table having the following form:
We will create the ManualBuild event handler, which will be doing the following:
get the data source, defined in the report;
initialize it (fill it with data);
print the table's rows as many times as there are rows in the data source.
Here is the code of the handler:
private void Table1_ManualBuild(object sender, EventArgs e)
{
// get the data source by its name
DataSourceBase rowData = Report.GetDataSource("Products");
// initialize it
rowData.Init();
// printing the table header
Table1.PrintRow(0);
Table1.PrintColumns();
// loop through the data source rows
while (rowData.HasMoreRows)
{
// printing the table row
Table1.PrintRow(1);
Table1.PrintColumns();
// select the next data row
rowData.Next();
}
// printing the table footer
Table1.PrintRow(2);
Table1.PrintColumns();
}
If we run the report, we will get the following:
Example 7. Inserting page breaks
Using the "PageBreak" method of the "Table" object, you can insert a page break when printing a table. Call it before you print a row/column.
We will use the Example 1 to demonstrate how the "PageBreak" method works. Let us print the third row on a new page.
private void Table1_ManualBuild(object sender, EventArgs e)
{
// print the row 0 with all its columns
Table1.PrintRow(0);
Table1.PrintColumns();
// print the row 1 with all its columns
Table1.PrintRow(1);
Table1.PrintColumns();
// insert page break before the row 2
Table1.PageBreak();
// print the row 2 with all its columns
Table1.PrintRow(2);
Table1.PrintColumns();
}
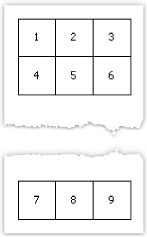
As a result, we get the following:
We will look at the use of the total function in Example 6. We will modify it in the following way:
If we run the report, we will get the following:
The "Matrix" object is a variety table and like the "Table" object, is made up of rows, columns and cells. At the same time, it is not known before hand how many rows and columns will be in the matrix - this depends on the data to which it is connected.
The object looks like this:
When printing, the matrix fills up the values and grows up and down. The result can be as follows:
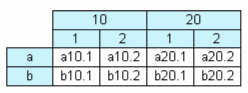
Let us look at the elements of a matrix:
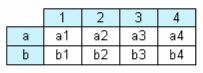
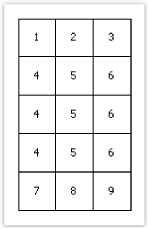
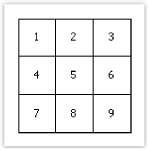
In the figure, we see a matrix with 2 rows and 4 columns. Here a, b - row header, 1, 2, 3, 4 -column header, a1...a4, b1...b4 - cells. In order to build such a report, only one data source will be needed, which has got 3 columns and contains the following data:
a |
1 |
a1 |
As seen, the first column represents the matrix row, the second - matrix column, and the third- contents of the cells at the intersection of rows and columns with the indicated number. When creating a report, FastReport creates a matrix in the memory and fills it with data. During this, the matrix dynamically increases, if the row or column with the given number doesn't exist yet.
A
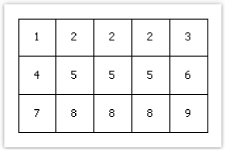
header can have more than one level. Let us look at the following example:
In this example, a column is compound, that is, it has got two values. This report requires the following data:
a |
10 |
1 |
a10.1 |
Here, the first column represents the row, the second and the third represent the matrix column. The last data column contains the value of the cell.
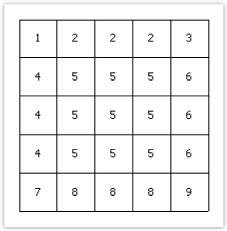
The
next matrix element - subtotal and grand total, the next figure demonstrates
it: 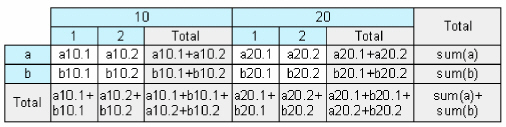
This report is built on the same data used in the previous example. Rows that shown grey in the figure, are calculated automatically.
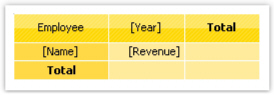
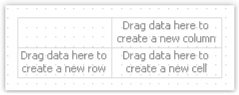
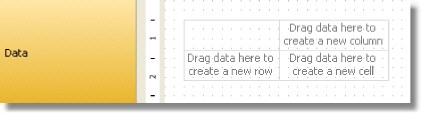
After you have placed a new "Matrix" object on a sheet, it will be as follows:
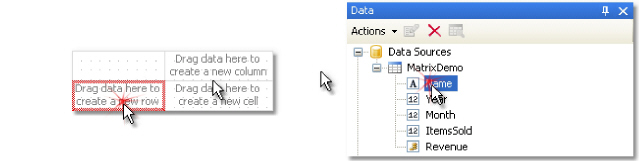
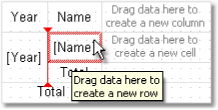
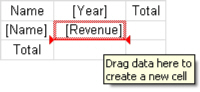
Matrix can be configured with the help of the mouse. To do this, drag and drop data source columns from the "Data" window onto the matrix, to create rows, columns and cells. The matrix highlights a red frame to a place where the new data will be placed:
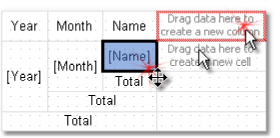
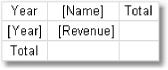
If the matrix contains some elements already, then when placing a new element, an indicator will be shown. In the given case, the new data will be placed between the "Year" and "Name" elements:
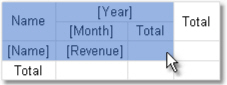
You can also change the order of the existing elements. To do this, click on the element's border (shown with black) and drag it to the needed place:
To delete an element, select it with the mouse, and press the "Delete" key.
To configure the header element, select it and right-click to display its context menu:
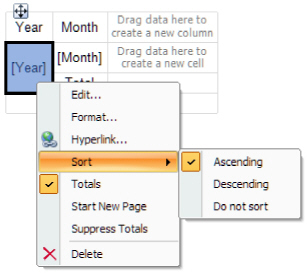
By default, data in the matrix header is sorted in ascending order. You can change the order of sorting, by selecting the "Sort" item.
Ordinarily, every item in the matrix header has a total (this is a cell with a "Total" text). You can delete the total, selecting it and pressing the "Delete" key. In order to enable total again, select an element to which it belongs, and choose the "Total" item in its context menu.
The "Start New Page" menu item tells the matrix to insert page breaks after printing each header value. For example, if you enable page breaks for the "Year" item (as shown in the picture above), every year value will be printed on its own page.
The "Suppress Totals" item allows to suppress totals in case when the group (on which the total value is calculated) contains only one value.
For a matrix cell, you can choose a function which will be used when calculating the total. A list of functions which can be used is given below:
Function |
Description |
None |
Cell value is not processed. |
Sum |
Returns the sum of the values in the matrix cell. |
Min |
Returns the minimum value. |
Max |
Returns the maximum value. |
Average |
Returns the average value. |
Count |
Returns number of nonempty values. |
By default, the Sum function is used. You can change this by selecting a cell and choosing the "Function" item in its context menu:
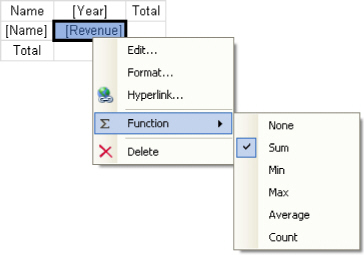
Choose the "None" function, if you don't intend to print the total in the given cell.
In a matrix, there can be one or several data cells. In case the matrix has several cells, they can be arranged side-by-side or on top of each other. The "CellsSideBySide" property of the matrix controls how the cells are arranged. It can be changed from the context menu of the "Matrix" object. You can also choose the arrangement order when adding the second cell in the matrix. When doing this, look at the red indicator which shows where the second value will be placed:
After you have added the second value, the rest of the values will be added in the chosen order.
In order to change the appearance of a matrix cell, click on the needed cell. With the help of the toolbar you can set up the font, border and fill. In order to change the appearance of several cells at once, select the group of cells. To do this, select the top left cell, and, without leaving the mouse, move the mouse so as to select the group:
You can use styles in order to change the appearance of the whole matrix. To do this, invoke the context menu of the "Matrix" object and choose the style:
Row and column size management
Since the "Matrix" object is a kind of "Table" object, it allows setting row and column sizes in the same way.
By default, a matrix has got the "AutoSize" mode enabled. In this mode, the matrix calculates the column/row sizes automatically. You can as well manage the size of the object manually. To do this, disable the "AutoSize" property of the matrix. Rows and columns have the same property, you can use it if autosize of the matrix is disabled.
In order to limit the minimum and maximum width of a column, select a column and set up its "MinWidth" and "MaxWidth" properties.
In order to limit the minimum and maximum height of a row, select a row and set up its "MinHeight" and "MaxHeight" properties.
Let us look at examples of using the "Matrix" object. For a start create a new report and put the "Matrix" object on the "Report Title" band. You can also use the "Data" band - in that case there is no need to connect the band to a data source. In the given case, it does not matter on which of the two bands you will put the matrix, since both bands will be printed once when the report is started. The report looking as follows:
Do not put "Matrix" object on bands which will be printed on every new page - "Page header", "Page footer", etc. The matrix in this case will be created every time when the band will be printed, which will lead to stack overflow.
Most examples will be using the "MatrixDemo" table, which is bundled with the FastReport package. This table contains the following data:
Name Nancy Davolio |
Year 1999 |
Month 2 |
ItemsSold 1 |
Revenue 1000 |
Nancy Davolio |
1999 |
11 |
1 |
1100 |
Nancy Davolio |
1999 |
12 |
1 |
1200 |
Nancy Davolio |
2000 |
1 |
1 |
1300 |
Nancy Davolio |
2000 |
2 |
2 |
1400 |
Nancy Davolio |
2001 |
2 |
2 |
1500 |
Nancy Davolio |
2001 |
3 |
2 |
1600 |
Nancy Davolio |
2002 |
1 |
2 |
1700 |
Andrew Fuller |
2002 |
1 |
2 |
1800 |
Andrew Fuller |
1999 |
10 |
2 |
1900 |
Andrew Fuller |
1999 |
11 |
2 |
2000 |
Andrew Fuller |
2000 |
2 |
2 |
2100 |
Janet Leverling |
1999 |
10 |
3 |
3000 |
Janet Leverling |
1999 |
11 |
3 |
3100 |
Janet Leverling |
2000 |
3 |
3 |
3200 |
Steven Buchanan |
2001 |
1 |
3 |
4000 |
Steven Buchanan |
2001 |
2 |
4 |
4100 |
Steven Buchanan |
2000 |
1 |
4 |
3999 |
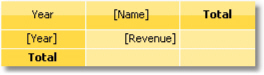
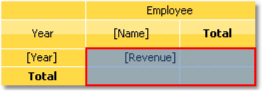
The matrix will contain one value in a row and a column as well as one data cell. In order to build a matrix you need to add "MatrixDemo" data columns in the following way:
add "Year" data column to the row header;
add "Name" data column to the column header;
add "Revenue" data column to the matrix cell.
After that the matrix will look as follows:
Let us improve the matrix appearance:
choose "Orange" style for the matrix;
choose "Tahoma, 8" font for all matrix cells;
select the word "Total" with bold type;
choose "Glass" type filling for the cells in upper row;
disable the autosize of the matrix and increase the size of rows and columns.
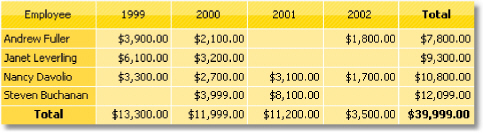
After that the matrix will have the following view:
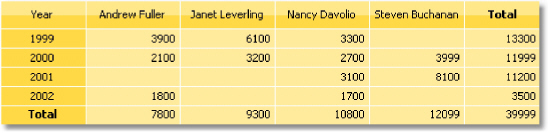
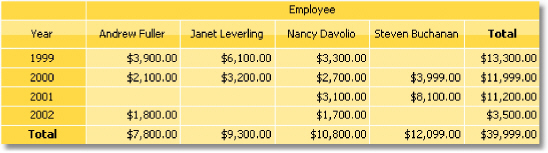
Run the report and you will see the following result:
There is lack of the following things in the matrix:
there is no title for the "Name" data column;
sums are not printed in currency format;
You can add a title for "Name" data column in the following way:
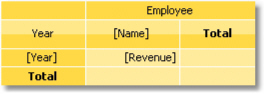
the text "Year/Employee" can be put into the left upper corner of the matrix;
diagonal line and the second "Text" object can be placed there, as shown below:
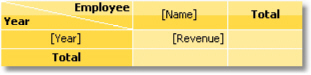
enable the matrix title. To do this, choose the "Show Title" item in the context menu of the "Matrix" object. Any text can be included in the title:
In order to set the data formatting, select the whole cell area, as shown in the figure below, and set format by selecting the "Format..." item in the context menu:
After that, a prepared report will be as follows:
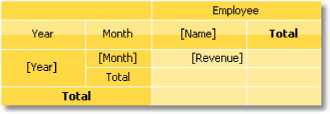
The matrix will have one value in a row, two values in a column and one data cell. We will get the previous example as a base and add a new item into it:
we will add the "Month" data column to the row header to the right of "Year" item.
After adding a new item, improve the appearance of the matrix. It is also necessary to set up formatting for cells. After that, the matrix will be as follows:
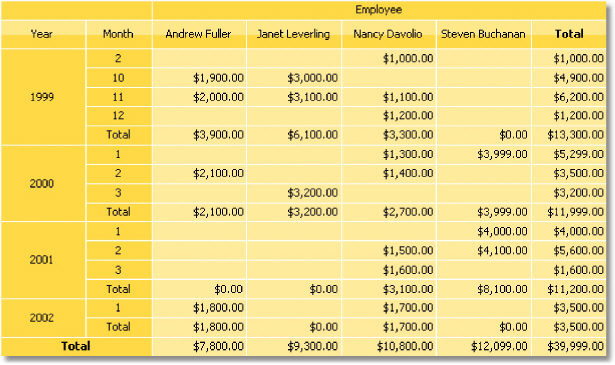
Run the report and you will have the following result:
Example 3. Printing the name of the month
In the previous example, there were numbers of months printed in a matrix. This occurred, because the "Month" data column contains the number of the month, not its name. In order to print the name of the month, do the following:
choose a cell where the number of the month is printed. In our case it is a cell with a name "Cell8";
in the "Property" window press
the ![]() button and
double click "BeforePrint" event;
button and
double click "BeforePrint" event;
FastReport will add an empty event handler in the report script. Write the following code:
private void Cell8_BeforePrint(object sender, EventArgs e)
{
string[] month Names = new string[] {
"January", "February", "March", "April",
"May", "June", "July", "August",
"September", "October", "November", "December"
};
// Cell8 is a cell that
prints the month number.
//
Cell8.Value is a value printed in the cell (i.e. the month number).
//
This value is of System.Object type, so we need to cast it to int
Cell8.Text = monthNames[(int)Cell8.Value
- 1];
}
When you run the report, you will have the following result:
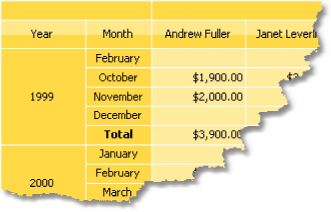
Example 4. Conditional highlighting
You can set conditional highlighting for matrix cells, just like for "Text" object. More details about this can be found in the "Conditional highlighting" section.
Let us look at Example 2, and see how to highlight an amount more than 3000 in red. For this,
select
the cell with "Revenue" text and press the![]() button
on "Text" toolbar. In the conditions editor, add the following
condition:
button
on "Text" toolbar. In the conditions editor, add the following
condition:
Value > 3000
Choose red text color for the condition. A prepared report will be as follows:
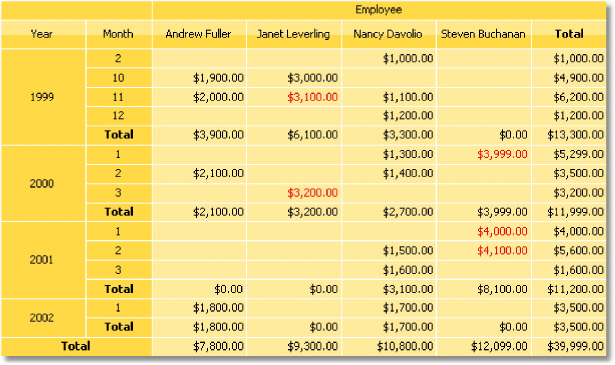
As seen, total values are not highlighted. This occurred, because we chose highlight condition for only one cell. To highlight the rest of the values, it is needed to set up the highlight for all matrix cells.
In this example we used conditional highlight which depends on cell value itself. Besides, you
can highlight a cell depending on values from matrix headers. We will show by the following example, how to highlight cells, which are belongs to 2000 year, in red. For this, select matrix cells as shown in the figure below:
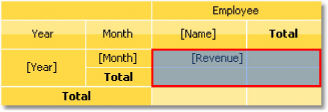
Set the following highlight condition:
(int)Matrix1.RowValues[0] == 2000
In this case "Matrix1" is a name of our matrix. The "RowValues" property of the matrix has got an "object[]" type and contains an array of values from the row header of the current printed row. Number of values in array is equal to number of levels in a header. There are two values in our example, the first one is "Year" and the second one is "Month".
Do not highlight the last row. "RowValues" property has an undetermined value for it and will cause an error when building the report.
When we run the report, we will have the following result:
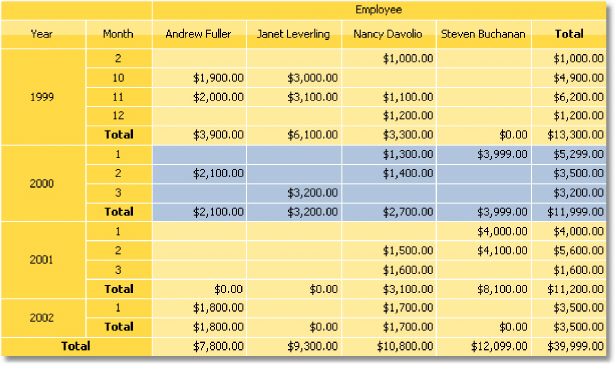
You can also use matrix's "ColumnValues" property for column values reference.
Example 5. Highlighting even rows
To improve the appearance of a matrix, you can highlight even rows or columns with other color. We will use the Example 2 to show how to do it.
Select the whole area of matrix data as it is shown in the figure:
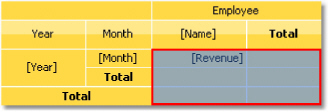
Call the conditional highlighting editor. Add the following condition:
Matrix1.RowIndex % 2 != 0
and choose background color a little darker than the previous one. In this example "Matrix1" is a name of our matrix. The "RowIndex" property of the matrix returns the number of the current printed line.
For column highlighting, use the matrix "ColumnIndex" property in the same way.
When we run the report, we will see the following:
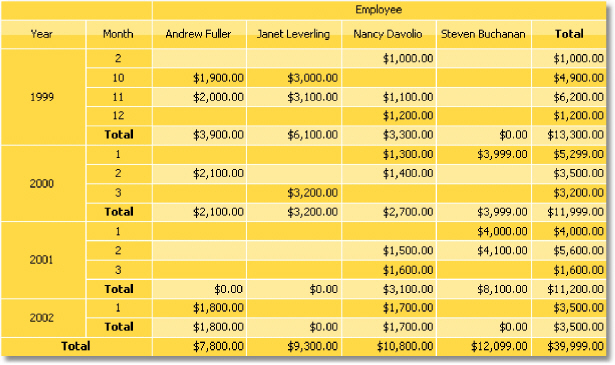
In previous examples we created matrix by dragging columns from the "Data" window. You can also use expressions for this purpose. In order to insert an expression into a matrix do the following:
add any element from "Data" window into matrix. It can be any element, for example, a system variable "Date" - we just use it to create a matrix element;
double click the element and select the needed expression in the expressions editor window.
If your matrix has expressions instead of data field, you have to check that the matrix "DataSource" property was set up correctly. When working with data columns, this property is filled automatically when you drag a column onto a matrix.
Let us consider an example on how to use expressions. For this, we will use the "Order Details" table as a data source, which contains a list of sold products, grouped by employees. There are several relations in this table, which gives an access to the name of an employee, product name and its category.
Our matrix will show each employee's sales, categorized by products. In order to build the matrix, do the following:
add the "Order Details.Products.Categories.CategoryName" data column to the column header;
add any item to the row header in order to create a matrix element. Then set the following expression for the header element:
[Order Details.Orders.Employees.FirstName] + " " + [Order Details.Orders.Employees. LastName]
add any item to data cell in order to create a matrix element. Then set the following expression for the cell:
[Order Details.UnitPrice] * [Order Details.Quantity] * (decimal)(1 - [Order Details.Discount])
Why
did we indicate such a long data column as a name of an employee though
we could get a name from the "Employees.FirstName"? We
did that because the matrix is connected to "Order Details"
data source. Using relations between this data source and other tables,
it is easy to refer to its columns (more details about relations
can be read in the "Data" chapter). If we refer directly
to the "Employees.FirstName" data column, we will get a name
of the first
employee in a table.
Set up the matrix appearance. After that it will look as the follows:
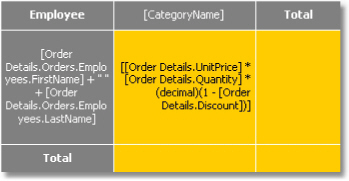
When we run the report, we will see quite a big matrix which occupies 2 sheets:
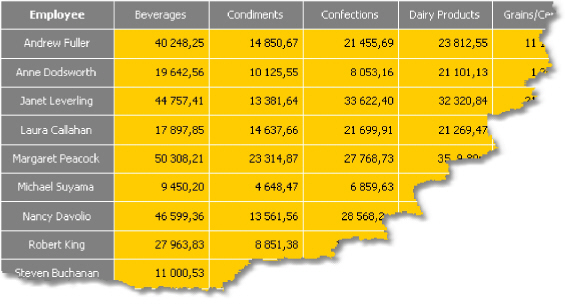
Matrix cells are inherited from the "Text" object and can display text data. If it is not enough, you can put any object into the cell. Let us see how to display a picture in a matrix.
For this we will take Example 6 as a basis. Let's add a photo of an employee ("Employees. Photo" data column) and the category picture ("Categories.Picture" data column). Do the following:
select the cell containing the employee's name and increase its size;
add the "Picture" object to this cell;
in order to show an employee's photo, bind the "Picture" object to the following data column (this can be done in the object editor):
Order Details.Orders.Employees.Photo
select the cell containing the category name and increase its size;
add the "Picture" object to this cell;
in order to show a category picture, bind the "Picture" object to the following data column (this can be done in the object editor):
Order Details.Products.Categories.Picture
After that the matrix will looks as follows:
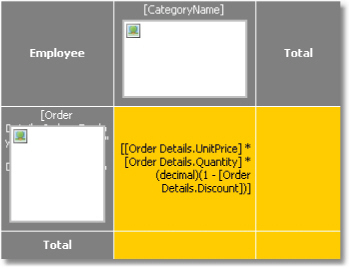
When we run the report, we will see the following:
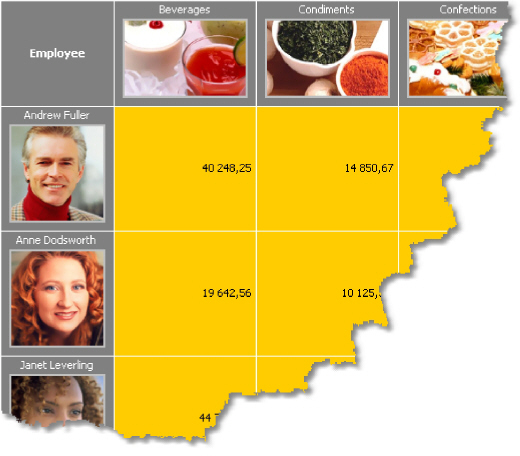
Using objects inserted into matrix cells you can have various visual effects. We will show in the following example, how to draw a simple scale indicating employee's sales level.
The matrix will use the "MatrixDemo" data source. To build a matrix, add data columns in the following way:
add "Year" data column to the row header;
add "Name" data column to the column header;
add "Revenue" data column to the matrix cell.
Set the appearance of the matrix in the following way:
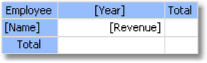
Now let us add three "Shape" objects to the cell with "Revenue" value.These objects will serve as indicators in the following way:
if value in a cell is less than 100, only one object of red color will be shown;
if value in a cell is less than 3000, two objects of yellow color will be shown;
if value in a cell is more or equal to 3000, three objects of green color will be shown.
Now the matrix looks like this:
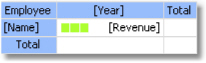
To control objects, we will use an event handler for a matrix cell. For this, select the "Revenue" cell, and create the "BeforePrint" event handler using the "Properties" window. Write the following code in the handler:
private void Cell4_BeforePrint(object sender, EventArgs e)
{
// In our example, a cell has the Cell4 name.
// Get cell value which is in the Cell4.Value property.
//
Some cells in our matrix will be empty. We'll take it into account (null
check).
//
The value should be cast to decimal type, because data source column
// [MatrixDemo.Revenue] is of System.Decimal type.
decimal
value = Cell4.Value == null
? 0
: (decimal)Cell4.Value;
// Switch shape objects
on or off depending on the value:
//
value < 100 - one object is visible;
//
value < 3000 - two objects are visible;
// value >= 3000 - all objects are visible
Shape1.Visible = true;
Shape2.Visible = value >= 100;
Shape3.Visible = value >= 3000;
// Choose the color of objects:
// value < 100 - red color;
// value < 3000 - yellow color;
// value >= 3000 - green color
Color color = Color.Red;
if (value >= 100)
color = Color.Yellow;
if (value >= 3000)
color = Color.GreenYellow;
// Set the objects' color
Shape1.Fill = new SolidFill(color);
Shape2.Fill = new SolidFill(color);
Shape3.Fill = new SolidFill(color);
}
When we run the report, we will see the following:
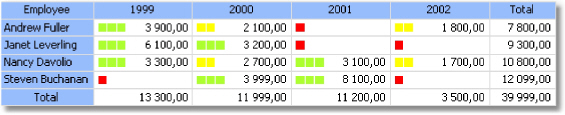
Example 9. Filling a matrix manually
In all the examples we have looked at, the matrix was filled with data automatically because it was connected to data source. Data source for the matrix is indicated in the "DataSource" property. Though we did not set the value of this property manually, it occurred implicitly while adding data columns to the matrix.
Using script it is possible to fill in the matrix manually. For this, it is needed to create the "ManualBuild" event handler of the matrix. Call "AddValue" method in the handler code to add a value. Let us show how to create a matrix which will print a 10afii1008710 table of the following kind:
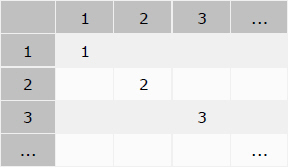
Do the following:
add an empty matrix into the report;
put any element from the "Data" window into the row, column and cell of the matrix. Then call expression editor by double clicking the matrix element and clear an expression;
clear the "DataSource" property of the matrix.
These steps are required to create a "dummy" matrix which has one row, column and cell. As a result the matrix will be as follows:
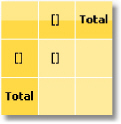
Now create a "ManualBuild" event handler. For that, select the matrix, go "Properties" window
and
press the ![]() button. Double
click the "ManualBuild" event and FastReport will create an empty
event handler. Write the following code in it:
button. Double
click the "ManualBuild" event and FastReport will create an empty
event handler. Write the following code in it:
private void Matrix1_ManualBuild(object sender, EventArgs e)
{
// Our matrix has one level in row, column and cell.
//
Create 3 arrays of object[] type, each with one element
// (per number of levels).
object[] columnValues = new object[1];
object[] rowValues = new object[1];
object[] cellValues = new object[1];
for (int i = 1; i <= 10; i++)
{
// Filling arrays
columnValues[0] = i;
rowValues[0] = i;
cellValues[0] = i;
// Adding data into the matrix
Matrix1.AddValue(columnValues, rowValues, cellValues);
}
}
In a handler, you should use the "AddValue" method of the "Matrix" object in order to fill it with data. This method has three parameters each of which is an array of System.Object type. The first parameter is a column value, the second one is the row value, and the third one is the cell value. Note that the number of values in every array should comply with the object's settings! In our case an object has one level in column, row and cell, correspondingly we supply one value for columns, one for rows and one for cells.
When we run the report, we will see the following:
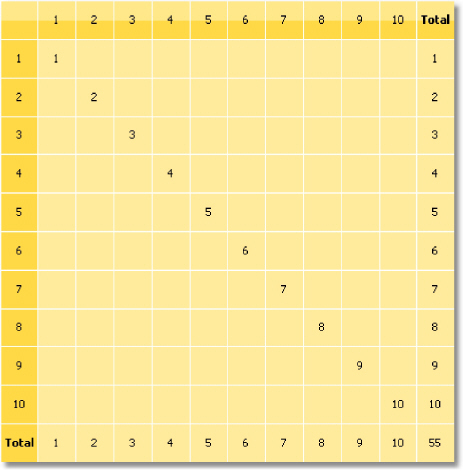
Let us demonstrate how to add a value "21" to the matrix, at the intersection of column 7 and row 3. For that, change a code in the following way:
private void Matrix1_ManualBuild(object sender, EventArgs e)
{
object[] columnValues = new object[1];
object[] rowValues = new object[1];
object[] cellValues = new object[1];
for (int i = 1; i <= 10; i++)
{
columnValues[0] = i;
rowValues[0] = i;
cellValues[0] = i;
Matrix1.AddValue(columnValues, rowValues, cellValues);
}
columnValues[0] = 7;
rowValues[0] = 3;
cellValues[0] = 21;
Matrix1.AddValue(columnValues, rowValues, cellValues);
}
As a result, we have the following:
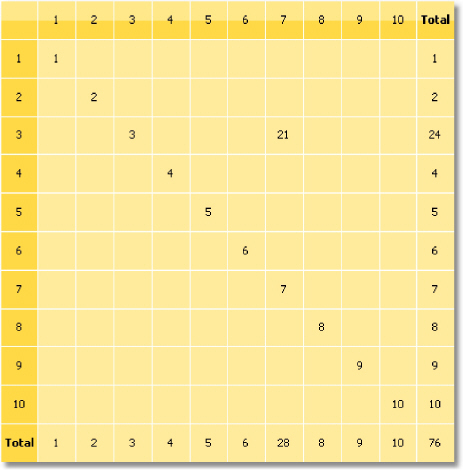
As seen, the matrix automatically calculates the totals.
You can use the "ManualBuild" event handler for the matrix which is connected to data. In this case, event handler is called first, then the matrix is filled with data from the data source.
A FastReport's prepared report can be made interactive. This means that, it will react to the user's actions in the preview window. You can use the following interaction:
when clicking on the report object, some kind of operation is performed. For example, you can run detailed report and show it in a separate window;
preview window can show the report outline, which can be used for navigating on the report.
Almost all report objects have the "Hyperlink" property. Using this property, you can define an object's reaction to the mouse click in the preview window.
When clicking such an object, one of the following can occur:
navigate to the URL address;
send e-mail;
execute any kind of system command;
navigate to the report page with the indicated number;
navigate to the bookmark, defined in another report object;
run detailed report in a separate preview window;
custom action, defined in a script.
To configure a hyperlink, select the object which you want to make interactive, and right click on it. In the context menu, select the "Hyperlink..." item. The hyperlink editor window will open:

Choose the type of hyperlink by selecting the tab in the left side of the window. After you have done, you may click the "Modify the object's appearance..." checkbox at the bottom of the window. The appearance of the object will change in the following way:
blue color will be set for the text and it will underlined;
a hand cursor form will be set.
In some cases hyperlink needs to be shown in the preview window, but there is no need to print it. This is easy to do, if you disable the "Printable" object property. This can be done in the "Properties" window.
Using this type of link, you can:
navigate to the given internet address;
execute some kind of system commands, for example, "mailto:" for sending an email.
When clicking on the link of this type, the System.Diagnostics.Process.Start method is executed with the link's value as a parameter.
You can indicate the value of the link by using two methods:
indicate the value directly, for example, "http://www.fast-report.com";
indicate an expression, which returns the value of the link. This expression will be calculated when you run the report.
By using this link type, you can organize navigation on the pages of a prepared report. Most often, navigation to the first page is used. For this, indicate the page number (1 in the given case) as a link value.
You can indicate the page number by using two methods:
indicate the number directly, for example,1;
indicate an expression, which returns the page number. This expression will be calculated when you run the report.
By using this type of link, you can navigate to a bookmark, defined in another report object.
For those who know the HTML language, it is enough to say that a bookmark acts like an anchor. A bookmark has got a name and a definite position in a prepared report (page number and position on the page). When moving to a bookmark by its name, you navigate onto the indicated position.
In order to use this link type, you first need to define the bookmark. In order to do this, select the object, where you want to move when you click on the link. Almost all report objects have the "Bookmark" property. Changing this property can be done with the help of the "Properties" window.
The "Bookmark" contains an expression, which you can use in the following way:
indicate the bookmark name as a string:
"MyBookmark"
indicate an expression, which returns the name of the bookmark. For example, you can use a data column as an expression. The value of the expression will be calculated when the report is run.
After the bookmark has been defined, you can indicate its name in the hyperlink configurations window. This can be done by using two methods:
indicate the name of the bookmark directly;
indicate an expression which returns the name of the bookmark. For example, this can be a data column. This expression will be calculated when the report is run.
Using this link type, you can execute another report and show it in a separate preview window. You must set the following parameters for this type of hyperlink:
detailed report's name;
name of the report's parameter, which will take the hyperlink's value;
hyperlink value.
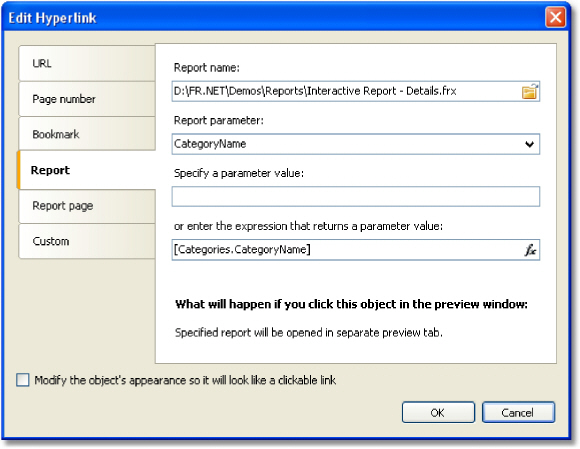
When the link is clicked, the following will take place:
the indicated report will be loaded;
the report's parameter will be set to the hyperlink's value;
the report will be built and run in a separate preview window.
Report parameter's value can be indicated by using two methods:
indicate the value directly;
indicate an expression, which returns the value. This expression will be calculated when the report is run.
This link type works in the same way, except that, another page in the current report is used as a detailed report. For this, your report must contain at least two pages: one with the main report, another with detailed one.
You must set the following parameters for this type of hyperlink:
page name in that report;
name of the report's parameter, which will take the hyperlink's value;
hyperlink value.
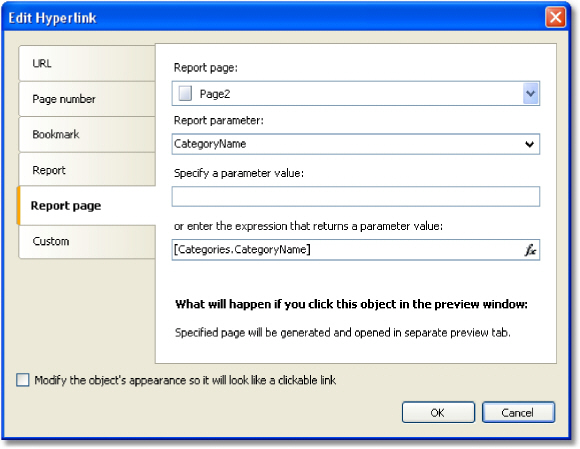
When the link is clicked, the following will take place:
the report's parameter will be set to the hyperlink's value;
the indicated report page will be built and shown in a separate preview window.
Report parameter's value can be indicated by using two methods:
indicate the value directly;
indicate an expression, which returns the value. This expression will be calculated when the report is run.
When you choose a report page, its "Visible" property resets to false. This means that, when the main report will be built, this page will be skipped.
Using this type of link you can define own reaction to the clicking of the mouse. For this, use the "Click" event handler of the object. To do this:
select the object and open the "Properties" window;
Click the ![]() button
to show the object's events;
button
to show the object's events;
double click on the "Click" event. FastReport switches to the "Code" window and creates an empty event handler.
In the handler's code, do everything what you need. You, most likely, will need a link to the object, which the handler calls, and a hyperlink's value. Use the handler's parameter sender:
private void Text2_Click(object sender, EventArgs e)
{
// sender - this is the object which was clicked.
//
In order to receive the value of the hyperlink, you need
//
to cast the sender to ReportComponentBase type.
object
hyperlinkValue = (sender as
ReportComponentBase).Hyperlink.Value;
MessageBox.Show("Hyperlink
value = " + hyperlinkValue.ToString());
}
Report outline (also known as the "document map") is a TreeView control displayed in the preview window:
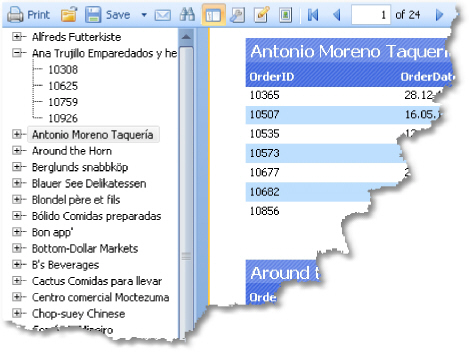
This control shows a tree structure, which was formed during the report building. If you click the tree element, you will navigate to the corresponding report element.
If the report has got an outline, it will be shown automatically. You can show or hide the
outline
by clicking the ![]() button
on the toolbar. The report does not create an outline automatically - you should take care about this.
button
on the toolbar. The report does not create an outline automatically - you should take care about this.
The report page and all its bands have the "OutlineExpression" property. To fill the outline, indicate an expression which returns the element's text in this property. This expression will be calculated when printing a band, and its value will be added to the outline. If your report is of master-detail or group type, the structure of the outline will be similar to the report's structure.
The "OutlineExpression" property can be set in the "Properties" window.
Here are the recommendations on how to configure the outline for different types of reports:
if you want to show the sheets of a prepared report in the outline, set the "OutlineExpression" property of the report page. The expression will return the number of the page:
[PageN]
in the "Simple list" report type with one "Data" band, set the "OutlineExpression" property of that band. As an expression, use any data column which is printed in the band;
in the master-detail report type with two "Data" bands, set the "OutlineExpression" property of the corresponding bands. For example, in the "Category/Product" report type, the "OutlineExpression" for the first band will contain the name of the category, for the second -product's name;
in the group report, configure the "OutlineExpression" property of the group header and a "Data" band. As an expression for the group header, use the grouping condition. For the "Data" band, use any data column which is printed in the band.
In this example, we will create a simple report with one "Text" object. When clicking on the object in the preview window we will move to the FastReport web-page.
Create a new report, and add the "Text" object. Write the following text into it:
Go FastReport home page
Right click on the object and select the "Hyperlink..." item in the context menu. Configure the link in the following way:
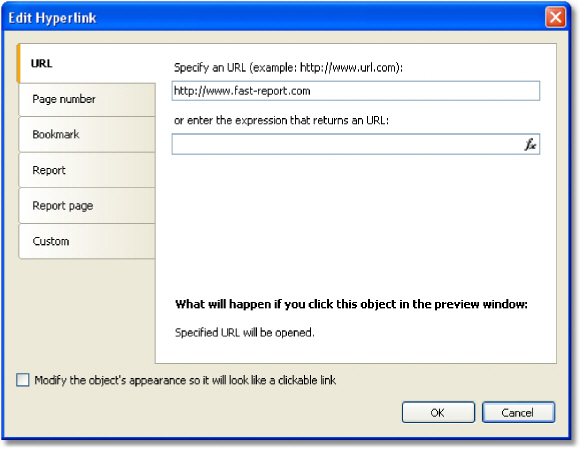
After this, enable the "Modify the object's appearance..." checkbox, in order to apply some link attributes (blue text color, underlining and a hand-like cursor) to the object.
Run the report and click on the object. The web-browser window opens, and you will move to the FastReport home page.
Example 2. Building a detailed report
In this example we will build a report that displays the category list. When clicking on the category name, a detailed report that contains the list of products' in the given category will be shown.
You need to do the following:
first create a detailed report;
define the report parameter which identifies a category;
set up data filtration on this parameter;
create the main report;
in the main report, configure the hyperlink such that, the detailed report can be run with the parameter set to the chosen category.
Firstly, we will create a detailed report which prints a list of products. For this, create a new report and choose the "Products" table as a data source. Place the objects in the following way:
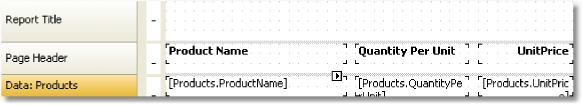
Create the parameter which will be used to pass a selected category from the main report to the detailed one. For category identification, we will use the "CategoryID" column which is contained in both "Categories" and "Products" tables. Configure the parameter in the following way:
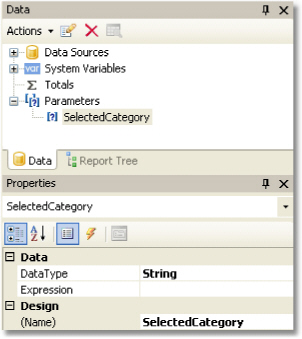
Now we need to set data filtering to filter all products that belong to the specified category. To do this, double click the "Data" band. Switch to the "Filter" tab and indicate the following condition:
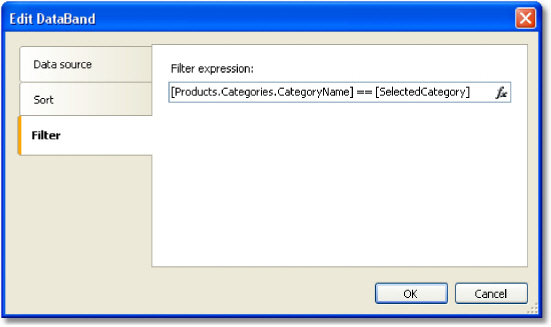
Now create the main report. Create a new report and choose the "Categories" table as a data source. Place the objects in the following way:
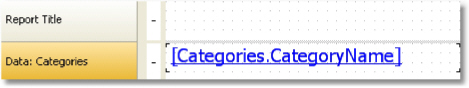
Right click on the "Text" object and select the "Hyperlink..." menu item. Set up the link in the following way:

As a report name, choose the name of the detailed report file. Report parameter can be chosen from the drop-down list, by pressing the button on the right side of the list. As a parameter value, indicate the "[Categories.CategoryID]" expression.
Run the report, and you will see the categories list:
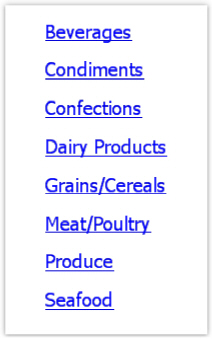
If you click on one of the categories, a detailed report will be built. It will be shown on a separate tab of the preview window:
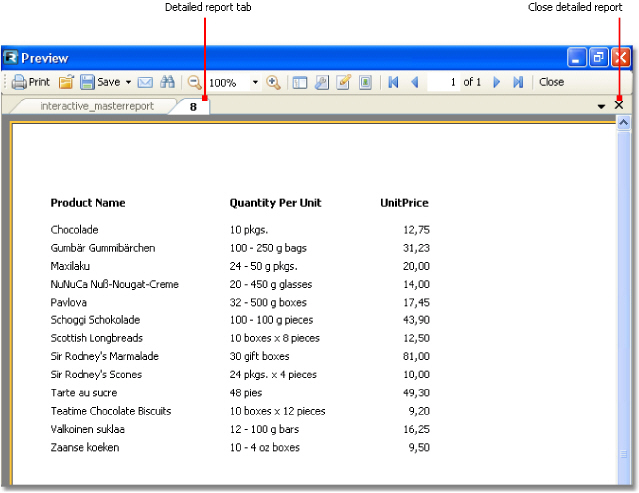
As seen on the picture, the title of the tab is set to the hyperlink's value. In our case, this is the numeric value contained in the "CategoryID" data column. This appears not informative and not beautiful. Let's change our report to use the category name instead of its number. For this, do the following:
In the detail report:
change the parameter's "DataType" property to the "String";
add the "Categories" data source into the report. It will be used for referring to the "CategoryName" column when filtering data;
change the filtering expression of the "Data" band:
[Products.Categories.CategoryName] == [SelectedCategory]
In the main report:
change the hyperlink settings. Now we will pass the "[Categories.CategoryName]" value into the report parameter.
If we run the report now, we will see that the title of the tab is set to category name. We can improve the detailed report a little. Add the "Text" object, which will print the name of the chosen category in the report title:
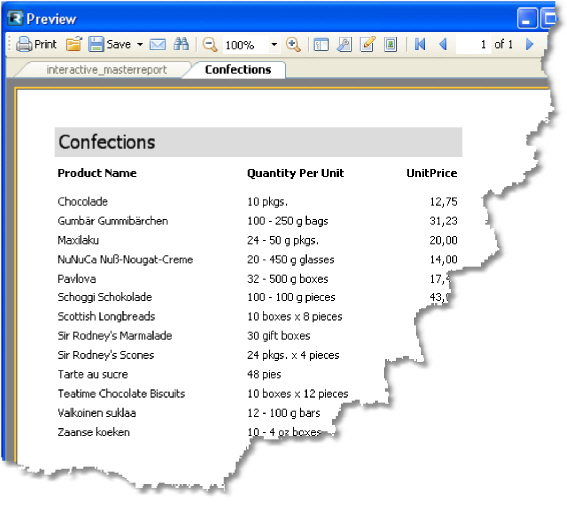
While we are working with this example, we have created two reports and swap between them several times. This is not very comfortable. In order to make the task easier, two reports can be placed into one: the main report will be on the first page, the detail one on the second page. In this case the hyperlink needs to be set in the following way:
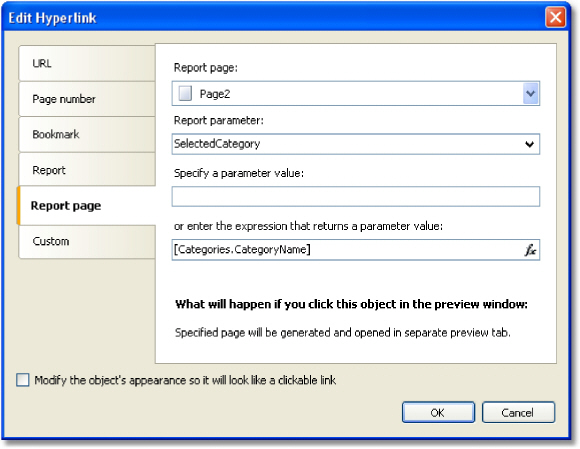
In the given case, we need to choose Page2 as the detail report page.
Example 3. Interactive "Matrix" object
In this example we will see how to build a detailed report if we click on the cell of the "Matrix" object. As an example, we will use a matrix which displays the sales of employees grouped by year.
As a data source for the matrix, the "MatrixDemo" table is used. It presents the sales of the employees, grouped by year and month:
Name Nancy Davolio |
Year 1999 |
Month 2 |
ItemsSold 1 |
Revenue 1000 |
Nancy Davolio |
1999 |
11 |
1 |
1100 |
Nancy Davolio |
1999 |
12 |
1 |
1200 |
Nancy Davolio |
2000 |
1 |
1 |
1300 |
Nancy Davolio |
2000 |
2 |
2 |
1400 |
Nancy Davolio |
2001 |
2 |
2 |
1500 |
Nancy Davolio |
2001 |
3 |
2 |
1600 |
Nancy Davolio |
2002 |
1 |
2 |
1700 |
Andrew Fuller |
2002 |
1 |
2 |
1800 |
Andrew Fuller |
1999 |
10 |
2 |
1900 |
Andrew Fuller |
1999 |
11 |
2 |
2000 |
Andrew Fuller |
2000 |
2 |
2 |
2100 |
Janet Leverling |
1999 |
10 |
3 |
3000 |
Janet Leverling |
1999 |
11 |
3 |
3100 |
Janet Leverling |
2000 |
3 |
3 |
3200 |
Steven Buchanan |
2001 |
1 |
3 |
4000 |
Steven Buchanan |
2001 |
2 |
4 |
4100 |
Steven Buchanan |
2000 |
1 |
4 |
3999 |
Configure the matrix in the following way:
put the "MatrixDemo.Year" data column in the column header;
put the "MatrixDemo.Name" data column in the row header;
put the "MatrixDemo.Revenue" data column in the cell.
A prepared matrix will be as follows:
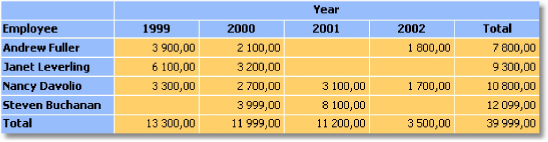
As seen, the value of a cell is the sum of employee's sales for the whole year. Let us create a detailed report which will be displayed when we click the cell. In our case the detailed report can contain the sales of a selected employee for every month of a selected year.
How to connect a cell with data, on which basis it was printed? Each cell of the matrix has got its own address. This is a combination of the values from the column and row headers. In our example, the address of the cell is a combination of the year and name of the employee. Exactly this data can be passed to the detailed report. How can this be done? Very simple: set the hyperlink, showing only the report name and name of the parameter. Parameter values do not need to be indicated: for a matrix cell, FastReport itself forms the value and passes it into the parameter.
Assuming that, we have clicked on the top left cell, containing the number 3900. This is the sum of the sales of the employee named "Andrew Fuller" for the year 1999. What form is used to pass this value into the parameter? FastReport combines column and row values, by using a separator:
1999;Andrew Fuller
Does it mean that we must extract the value of the year and the name of the employee from this string, convert the year into the int, and use these values for data filtering? No, it's much
simpler. All that we need to do is to create a parameter that has nested parameters. You can learn about this in the "Data" chapter. In the given case, parent parameter can be like this:
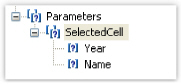
When creating the parameter, consider the following moments:
you don't need to set up the parent parameter. Just give it the name;
a parent parameter must have as many nested parameters, as there are values passed from the matrix. In the given case, there are two values;
order of the nested parameters must correspond with the order of the values passed from the matrix. In our case, the year will be passed in the first parameter, and the employee name will be passed in the second parameter;
nested parameters can be named as you wish,
but it is better to give them names which
correspond with the names of the matrix elements;
it is very important to set the data type for every nested parameter correctly. Data type must correspond with the value, which is passed into the parameter. In our case, the first parameter (Year) must be an integer type, and the second (employee name) - String.
After we have clarified all the needed things, we will create the report. Select the cell of the matrix and call the hyperlink editor:
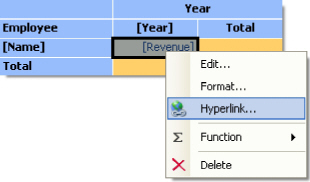
In the hyperlink configuration, indicate the parent parameter as a report parameter (in our example - "SelectedCell"):
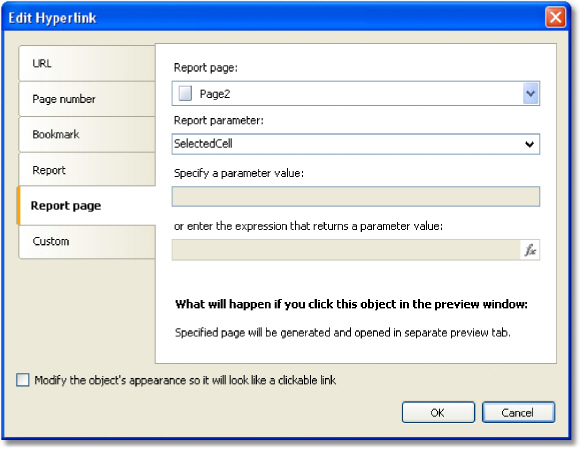
FastReport passes the values into the SelectedCell.Year and SelectedCell.Name nested parameters. These values will be converted into data types, indicated in the parameter configuration - this is why it is important to configure parameter data types correctly.
Detailed report is placed on a separate page of the main report and uses the same data source:
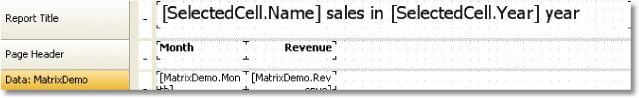
In order to show the sales of a chosen employee for a chosen year, set up the filtering. For this, open the "Data" band editor and indicate the following filtering condition:
[MatrixDemo.Year] == [SelectedCell.Year] && [MatrixDemo.Name] == [SelectedCell.Name]
The report is ready. Run it for execution and click on the top left cell. A detailed report will be opened, having the following data:
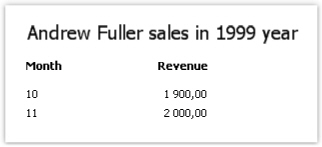
As seen, the sum of the values (1900+2000) corresponds with the cell of the matrix, on which we clicked.
Example 4. Report with table of contents, navigation and outline
In this example, we will look at creating a report, which has the following features:
on the first page it will print the "Table of Contents" (TOC) which is interactive, i.e. you can click its elements to navigate to the corresponding page;
in the preview window, it will display the outline, which is interactive as well.
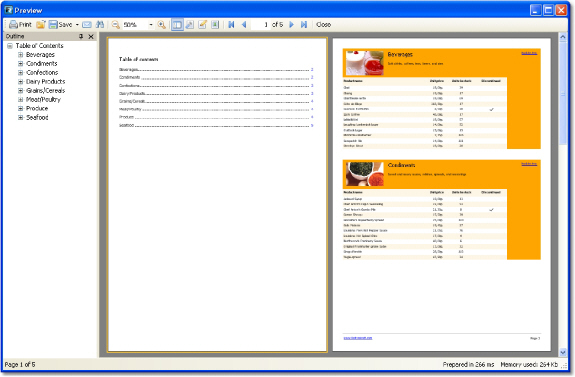
The report will use the "Categories" and "Products" tables. In the TOC, we will print the categories list. The rest of report will print the categorized list of products. Report template will be made up of two pages: the first page will be used to print the TOC; the second one is the main part of the report.
We will discuss the TOC firstly. Create a new report and add "Categories" and "Products" data sources into it. Connect the "Data" band to the "Categories" table and place the objects in the following way:
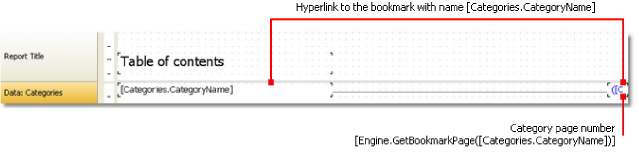
In order to make the TOC objects interactive, configure its "Hyperlink" property:
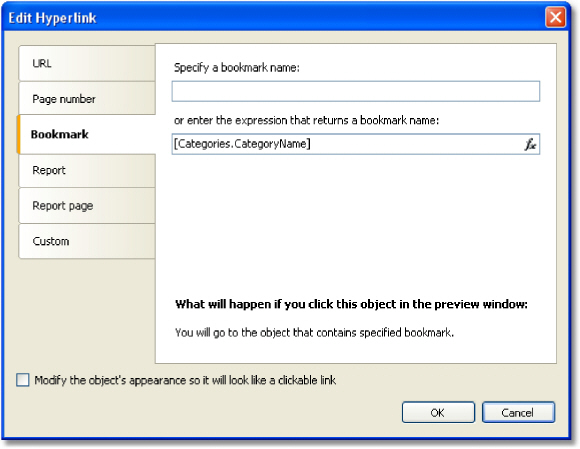
Indicate the category name as a bookmark. We will define the object's bookmark later.
In order to print the page number in the TOC, you need to do the following:
enable the "double pass" setting of the report. This can be done in the "Report|Options..." menu. This needs to be done, because the TOC page is printed before other pages. At this moment FastReport does not know where the categories will be printed;
use the "Engine.GetBookmarkPage" function, which returns page number for the specified bookmark. In our case, we use the "[Categories.CategoryName]" expression as a bookmark name, so the function call will be as follows:
[Engine.GetBookmarkPage([Categories.CategoryName])]
On the second page of the report, we will create a master-detail report as shown in the figure below:
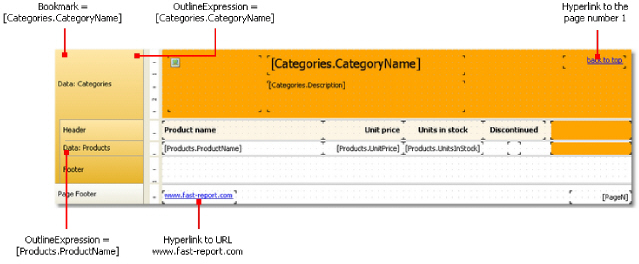
Set up the bookmark we navigate to when clicking on an element in the TOC. For this, select the first "Data" band and indicate the following expression in its "Bookmark" property:
[Categories.CategoryName]
To set up the report outline, do the following:
select the first report page. This can be done by switching to the page;
in the "Properties" window, set the following value to the "OutlineExpression" property:
"Contents"
switch to the second report page;
select the first "Data" band and set its "OutlineExpression" property:
[Categories.CategoryName]
select the second "Data" and set its "OutlineExpression" property:
[Products.ProductName]
Often we have many reports with the same data in it - for example, same header/footer with company logo and some data - email, address etc. Now imagine the situation, that you need to change some company data - for example, email. You have to do this in each report! To avoid this, you can use report inheritance. What is it?
For example, you have some common elements in each report (logo, company name, email etc). These elements are typically placed on the report title and/or page header. You can create a base report that contains only common elements. All other reports will use base report and thus will contain such common elements plus own elements defined in a report.
In case you need to change something (logo, email) you just open the base report and make necessary changes. All other reports that inherit from a base, will be changed automatically. In fact, when you open a report that is inherited one, the base report is opened first, then the inherited one.
To use the inheritance, you need to do the following:
create a base report and save it to a file;
create a new report that inherits from base.
To create an inherited report, choose the "File|New..." menu item, then choose the "Inherited report" item in the window:
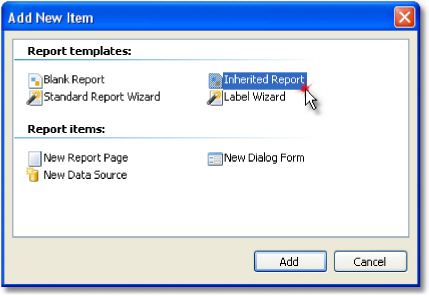
You will be asked to select a base report file. That file must be created at this moment. After that, the base report will be loaded into the designer. You can change it as you want. You see that objects from the base report are marked with the "lock" sign:
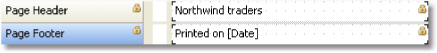
That means, you cannot delete such objects, rename it or move to another band.
You can add new objects or bands, change the object's appearance, size and location. When you have done, save the report.
Let us look what happens if we change the base report. We can:
delete the object from the base report. This object will be deleted from the inherited report as well;
add the object into the base report. This object will appear automatically in the inherited report;
change the size, location, text, appearance of the object. All changes will be reflected in the inherited report, in case where this object was not changed in the inherited report.
The last point requires some explanations. Let us look at two examples of using inheritance. In the first example, we will do the following:
create a base report which contains the Text1 object;
create an inherited report and just save it, without changing anything;
open the base report and move the Text1 object;
open the inherited report and we will see that the Text1 object is moved as well.
In the second example, we will do the following:
create a base report which contains the Text1 object;
create an inherited report;
in the inherited report, move the Text1 object to a new position and save the report; open the base report and move the Text1 object to different position;
open the inherited report and we will see that the Text1 object is not moved.
It happens because we have changed the object in the inherited report. This change was saved in the inherited report file. Now, if we change the original object in the base report, it will be ignored in the inherited report. In this case, the new object's location will be ignored. All other changes (such as text color, for example) will still be reflected in the inherited report.
This
behavior will become clear if we look at the contents of inherited report
file. For example, this is how the original object is saved in the
inherited report, in case this object was not
changed:
<inherited Name="Text1"/>
If we change the object's location in the inherited report, it will be saved like this:
<inherited Name="Text1" Left="255.15" Top="28.35"/>
When opening the inherited report, FastReport will load all object's properties, defined in the base report, plus properties, saved in the inherited report.
The
report inheritance was designed to meet the following goal: save common
report elements such as headers and footers in separate files, and
reuse them in inherited reports. Do not try
to use the inheritance to perform more complex tasks. In particular, avoid
to do the following:
do not inherit the report from the inherited one (i.e. do not inherit twice);
do not use complex objects such as Table and Matrix, in the base report;
do not use script in the base report;
do not use parameters in the base report.
FastReport uses Microsoft Chart library to display charts. This library will be included in .Net Framework 4.0. Now it is available as a separate download here:
http://www.microsoft.com/downloads/details.aspx?FamilyID=130f7986-bf49-4fe5-9ca8-910ae6ea442c
This library requires .Net Framework 3.5 SP1. It is freeware; you can learn about its features here:
http://code.msdn.microsoft.com/mschart
Let us highlight some features of Microsoft Chart:
more than 30 types of series (bars, columns, areas, lines, bubbles, pie, circular, financial, pyramidal, ranges);
3D support;
supports several series of different types in one chart;
full control over appearance and behavior of each chart element.
Microsoft Chart consists of the following elements:
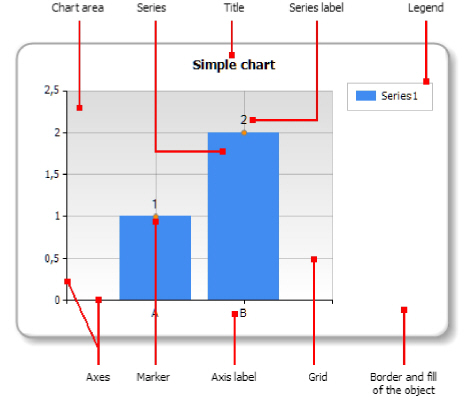
One chart may have one or several chart areas. One chart area may contain one or several series. Below you can see the chart which contains two chart areas (the first area contains two series, the second area contains one series):
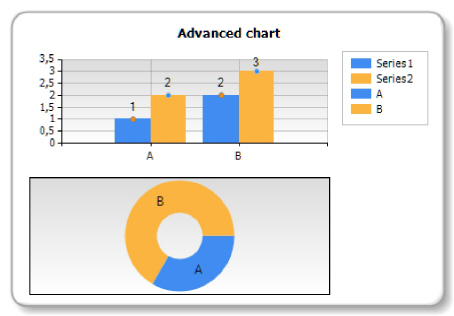
Some series (for example, pie series) require exclusive chart area.
The "Chart" object contains numerous settings which can be handled in the chart editor. To invoke the editor, double click the "Chart" object:
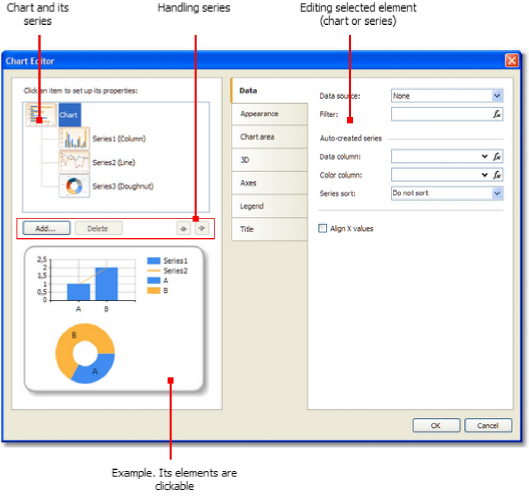
The "Chart" object can contain one or several series. Series list is displayed in the editor:
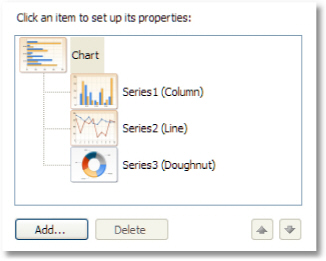
To add a new series, press the "Add..." button. You will see the "Gallery" dialog:
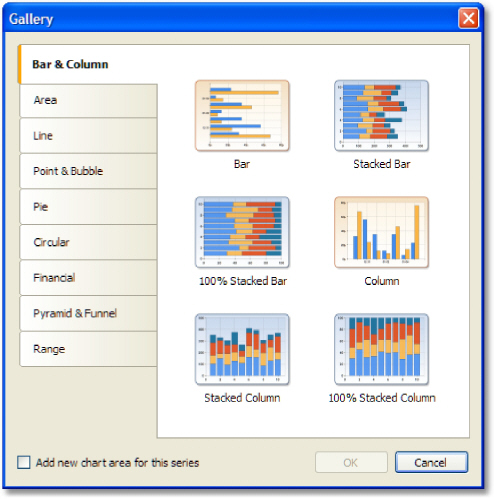
Select the needed category, then - needed series type. If you want to place the series in its own chart area, check the "Add new chart area for this series" checkbox. For some series types (such as pie, circular, financial, pyramidal) the new chart area is added automatically regardless of this checkbox state.
To delete the series, press the "Delete" button. To change series order, use "Up" and "Down" buttons.
Using the chart editor, you can set up appearance of each chart element. All properties (more than 100) are splitted in several categories. Some of them are specific to "Chart" object, while others are part of series.
If you choose the "Chart" object from the series list, you will see the following property pages:
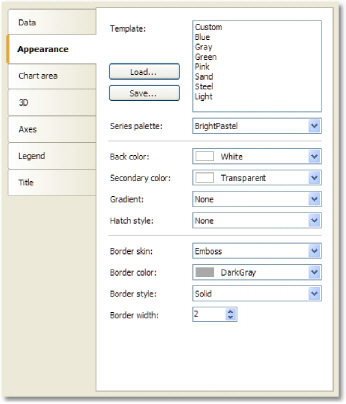
"Appearance" - border and fill of the chart;
"Chart area" - border, fill, shadow;
"3D" - 3D settings;
"Axes" - setup appearance of axis, its title, labels, grid, markers, custom labels and strips; "Legend" - style of legend, docking, border, fill, shadow and font;
"Title" - style of title, docking, border, fill, shadow, font.
If you choose the series object from the series list, you will see the following property pages:
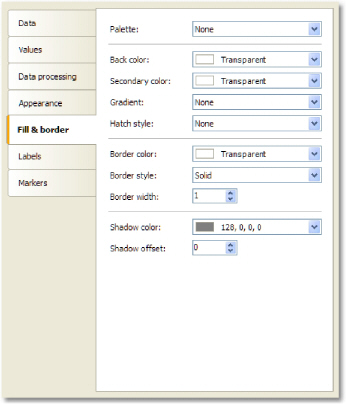
"Appearance" - some settings specific to the selected series type;
"Fill & border" - fill and border of the series values;
"Labels" - series labels. You can choose label type, font, color and fill;
"Markers" - series markers. You can choose marker type, its color and border.
You can fill the chart with data in several ways:
1.Use data source. To do this, you need to indicate the data source for the "Chart" object and
connect each series to data columns.
2.Use fixed values for each series.
3.Fill the object with data using the script.
To connect the chart to a data source, follow these steps:
select the "Chart" object in the series list;
switch to the "Data" tab;
choose the data source:
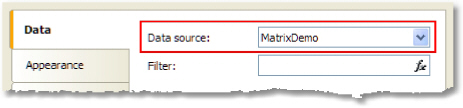
if necessary, set the data filter expression. This filter will be applied to all chart series;
select the series in the series list;
switch to the "Data" tab;
choose data columns for each series value. Depending on series type, it may have two or more values. Most series types have two values - X value and Y value:
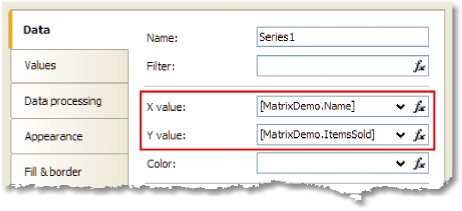
if necessary, set the data filter expression. This filter will be applied to current series only;
in the "Color" control, you may indicate a data column which returns a color value.
You may also provide list of values for the series. In this case, the data connection is not needed. To do this, select a series in the series list and switch to the "Values" tab. Fill the table with values:
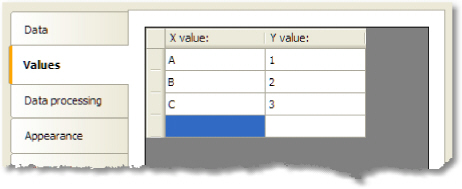
By default, the chart object displays data in natural order. You can change the sort order; to do this, select the series from the series list and switch to the "Data processing" tab:
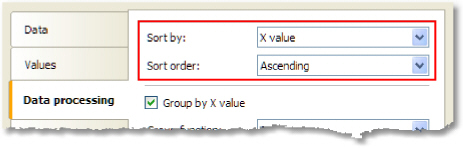
You can choose one of the sort modes - do not sort, sort by X value, and sort by Y value.
Sometimes we face a problem when series is filled with data with several identical X values. For example, the MatrixDemo table, which is used to demonstrate charts, has the following data:
Name |
Year |
Month |
ItemsSold |
Revenue |
Andrew Fuller |
2002 |
1 |
2 |
1800 |
Andrew Fuller |
1999 |
10 |
2 |
1900 |
Andrew Fuller |
1999 |
11 |
2 |
2000 |
Andrew Fuller |
2000 |
2 |
2 |
2100 |
Janet Leverling |
1999 |
10 |
3 |
3000 |
Janet Leverling |
1999 |
11 |
3 |
3100 |
Janet Leverling |
2000 |
3 |
3 |
3200 |
...
If we try to build a chart based on this data (for example, employee's sales - set X value to Name column, Y value to ItemsSold column), we will get the following wrong result:
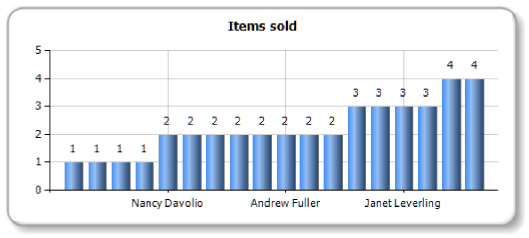
In this situation, we need to group the same employees into one value. To do this, select the series in the series list, and switch to the "Data processing" tab. Select the group type - "X value" and choose "Sum" as group function:

As a result, all identical employees will be grouped into one value, their sales will be summarized. You will see the following result:
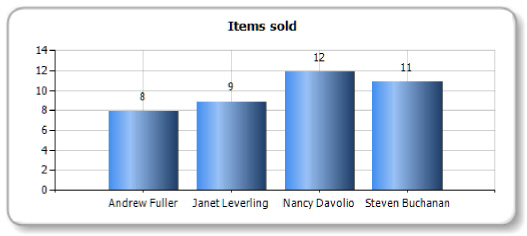
This instrument for data processing allows to collect several series value into one value. You can choose one of the following algorithms:
Algorithm |
Description |
TopN |
Only top N values are displayed. All other values are collected and displayed as "others" value (you can choose the label for this value). |
BottomN |
Bottom N values are displayed. If the text for the collected value is not set, this value is not displayed. |
Less than value |
Series values less than specified value, are collected and displayed as "others" value. |
Less than percent |
Series values less than specified percent, are collected and displayed as "others" value. |
Greater than value |
Series values greater than specified value, are collected and displayed as "others" value. |
Greater than percent |
Series values greater than specified percent, are collected and displayed as "others" value. |
For example, to display top 5 values, set up the series in the following way:
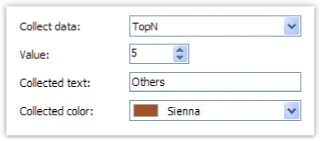
You will get the following result:
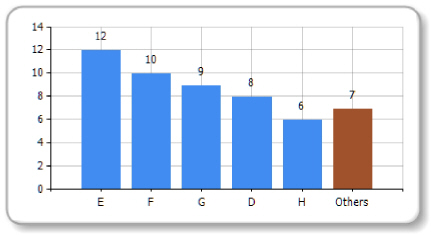
For pie-type series, you can explode some values. To do this, select the series in the series list and switch to the "Data processing" tab:
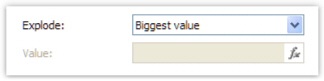
You can use one of the following explode types: biggest value, lowest value and specific value. If you choose the latter mode, you have to specify a value which you want to explode. It may be any expression (see the "Expressions" chapter for details). For example, if you need to explode Andrew Fuller's value, use the following expression:
"Andrew Fuller"
You will get the following result:
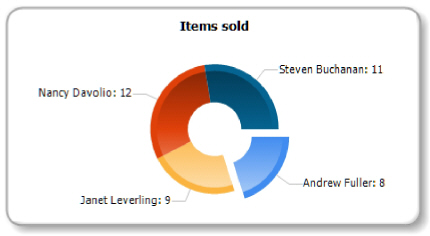
You can set up the chart so it will create new series automatically, depending on data in a data source. To set up auto-series, do the following:
create one series and set up its properties. This series will be used as a template for all new series;
select "Chart" object and set up the auto-series data column. The value of this column will be a name of new series. If there is no series with such name yet, the new series will be added.
Let us demonstrate how to create auto-series. We will use the MatrixDemo data table to get a chart of employee's sales per year. One series will represent one year. To do this:
connect the chart to the MatrixDemo data source;
create one series and set up its data:

on the "Data processing" tab, check the "Group by X value" checkbox. It is necessary because our data source has several employees with the same name;
select the chart in the series list and set up its auto-series column on the "Data" tab:
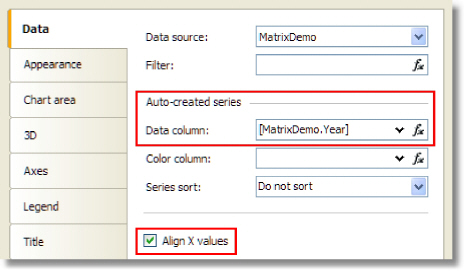
our series may have different number of values (because some employees do not have sales in this particular year). To align series values, check the "Align X values" checkbox.
We will get the following result:
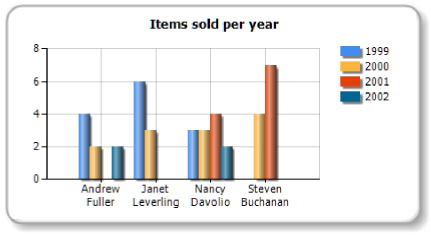
The chart, as well as other report objects, can be interactive. You can set up chart in the way, that when you click its value, another (detailed) report will be executed and shown. To do this, you need to set up the "Hyperlink" property as described in the "Interactive reports" chapter. The chart will pass the value to a hyperlink by itself, when you click on its element.
Let us observe the "Charts/Interactive Chart" report from the FastReport demo program.
Create a report with two pages. The first page will contain a chart, the second one will contain a detailed report that will be displayed when you click a chart value.
Place the "Chart" object on the first report page and set up its properties in the chart editor:
select the "Chart" element from the series list and choose the MatrixDemo data source;
select the series from the series list and set up X and Y values: X = [MatrixDemo.Name], Y = [MatrixDemo.ItemsSold]:

switch to the "Data processing" tab and select the group type - "X value":
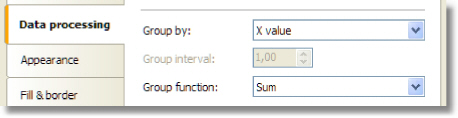
On the second report page, create the list-type report:
in the "Data" window, create a new report parameter called "SelectedEmployee";
create the following report layout:
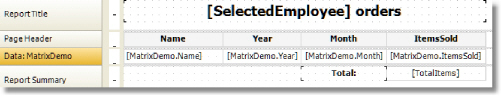
open the data band editor and indicate the following filter condition:
[MatrixDemo.Name] == [SelectedEmployee]
Now set up the hyperlink of the "Chart" object:
in the context menu of the "Chart" object, select "Hyperlink...";
choose the hyperlink type - "Report page";
choose the second report page and indicate the parameter name - SelectedEmployee.
The report is finished. Run it and move the mouse to any chart value. This value will be visually selected, and the mouse cursor will change its shape:
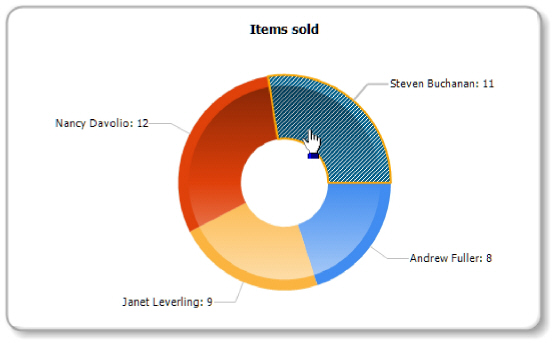
If you click the value, you will see the following detailed report:
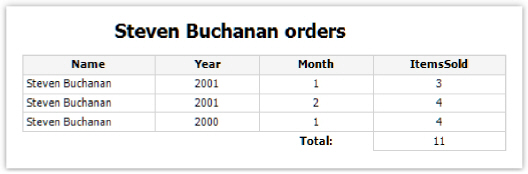
The MapObject component is intended for displaying 2D maps in •ESRI shapefile” format. You can find information on this file format at:
http://en.wikipedia.org/wiki/Shapefile
Two files are required - .shp (shape format; the feature geometry itself) and .dbf (attribute format; columnar attributes for each shape).
The "Map" object consists of the following elements:
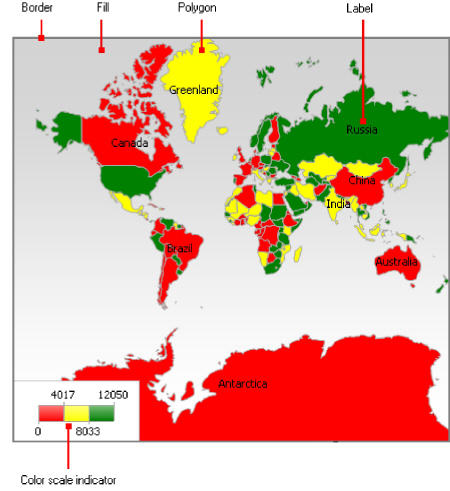
One "Map" object can display one or more layers. Each layer contains its own map.
Controlling the map with the mouse
In the report designer and in the preview window the map can be controlled by the mouse:
- zoom in and out using the mouse wheel
- pan the map by dragging the left mouse button
- change a polygon's properties in the "Properties" window by clicking the left mouse button inside a map polygon
The minimum and maximum zoom values can be set in the MinZoom and MaxZoom properties. These properties are changed in the "Properties" window.
The map cannot be controlled in the asp.net report viewer.
The
"Map" object has many properties, which can be set in the object
editor. The editor is opened by double-clicking on the object, or
from its context menu: 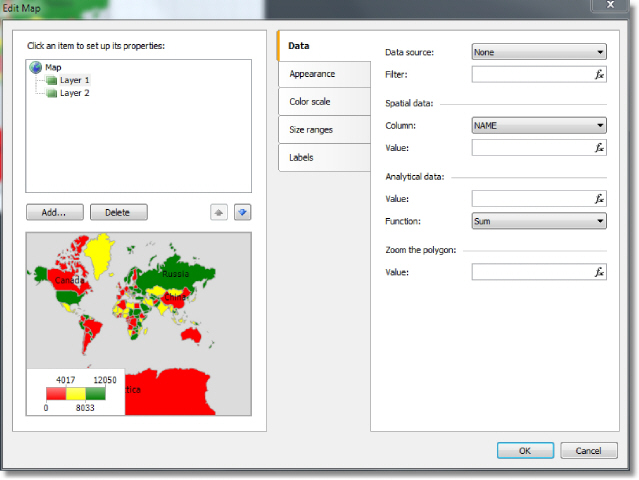
The "Map" object can contain one or more layers. The layer structure is displayed in the upper left part of the editor window:
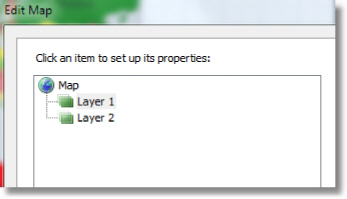
To add a new layer, click on the "Add..." button, which opens the following dialog:
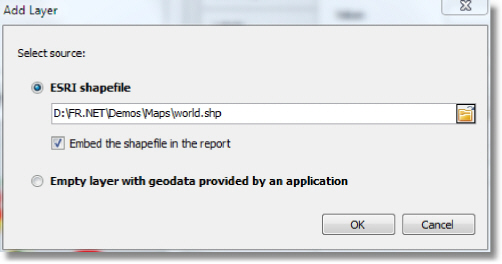
At this point, choose the type of the layer, from:
- the map from an ESRI shapefile. This is the most commonly used type for maps. For example, you can display the world map and highlight some countries in color, depending on the sales level for these countries;
- the geodata from your application. Your application must provide the following data: latitude, longitude, name and value. This data is displayed as a small point on the layer. The point can have a caption and can also have a variable size/color, dependent on the value provided. In practice, this type of layer is used together with a base layer of "ESRI shapefile" type. The base layer (the first one) is configured to display a country map (for example) and the second layer (geodata from an application) displays points - city names where sales occurred. The color and size of a point can be configured to reflect sales level.
If the "ESRI shapefile" layer type is chosen, select how the map data is stored, from:
- the whole map data is embedded in the report file. In this case the report file (.frx) may be large;
- the report file holds a reference to the map files (.shp/.dbf). This mode is useful if several reports use the same map files.
Large map files (more than 30Mb) or map files containing a lot of polygons (more than 20,000) slow down report generation.
Setting up the layer appearance
To set the layer appearance, choose the layer and switch to the "Appearance" tab:
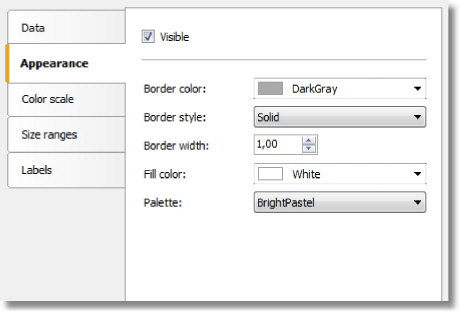
Set the border color and style of the map polygons and choose the color palette. Note that the palette is ignored if you configure the color scale (more about this later).
The map can display labels, such as country names. Set the label type and appearance on the "Labels" tab:
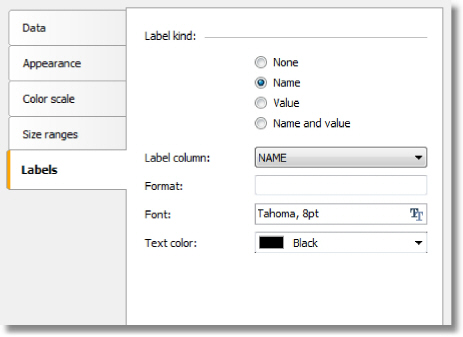
If the "ESRI shapefile" layer type is chosen set the field name which contains the displayed information. As a rule, it's a "NAME" field. The world map included in the FastReport demo program contains the following fields:
- NAME (eg: Germany)
- ABBREV (eg: Ger.)
- ISO_A2 (eg: DE)
- ISO_A3 (eg: DEU)
Other maps will have a different set of fields.
If the •application geodata” layer type is chosen set the minimum zoom value for displaying the labels. The default value is 1, meaning the labels are always displayed.
Connecting the map layer to data
Most reports use the "Map" object to display analytical data, for example sales levels in various countries. So a map layer must be connected to a data source using the map object editor window. Select the layer from the layers tree and switch to the "Data" tab. Data appropriate for the map layer type must be provided:
- for map layer type "ESRI shapefile" the "Data" tab looks like:
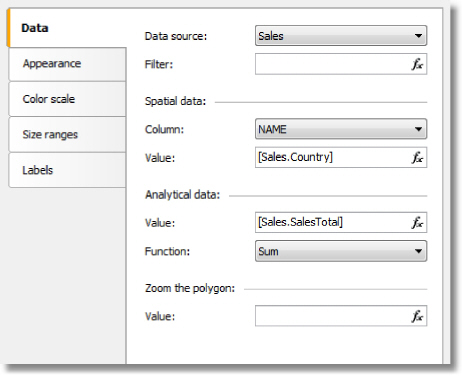
The data required is:
- name (eg: the country name);
- numeric value (eg: sales volume in this country).
For example, a "Sales" data source may have this data:
Country SalesTotal
------- ----------
USA 500000
Germany 1200000
Russia 300000
Set up the "Data" tab in the following way:
- data source: Sales
- spatial data, column name: select the column containing country names; usually this is the "NAME" column
- spatial data, value: [Sales.Country]
- analytical data, value: [Sales.SalesTotal]
- analytical data, function: "Sum"; this function is used if you have several values per country.
The "Zoom the polygon" edit box allows zooming of the polygon with a given name, so it occupies the whole "Map" object workspace. For example, to zoom Germany on the world map, type "Germany" (with quotes) in this edit box.
- for map layer type "geodata from an application" the "Data" tab looks like:
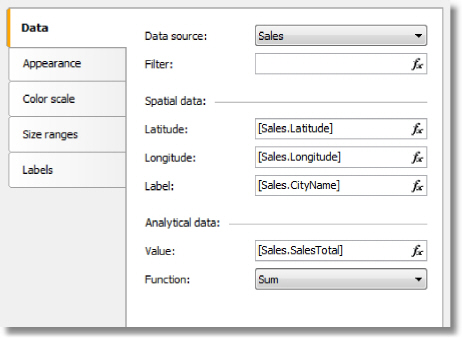
And the data required is:
- spatial data : latitude and longitude;
- label (eg: a city name);
- numeric value (eg: sales volume in this city).
For example, a "Sales" data source may have this data: Latitude Longitude CityName SalesTotal
-------- --------- -------- ----------
48.13641 11.57753 München 50000
50.94165 6.95505 Köln 36000
Set up the "Data" tab in the following way:
- the data source: Sales
- spatial data, latitude: [Sales.Latitude]
- spatial data, longitude: [Sales.Longitude]
- spatial data, label: [Sales.CityName]
- analytical data, value: [Sales.SalesTotal]
- analytical data, function: "Sum"; this function is used if you have several values per city.
Highlighting data using colors
After
you have finished connecting a layer to its data, the next question is
- how to display analytical data (for example the sales volumes in
various countries)? The easiest way is to set up labels displaying
a country name and its sales (see "Setting up label display").
More visual impact can be achieved by painting each country with
a color, dependent on its sales volume. For example, low sales as
red, mid sales as yellow and high sales as green. This is done by
setting up the color scale on the "Color scale" tab:
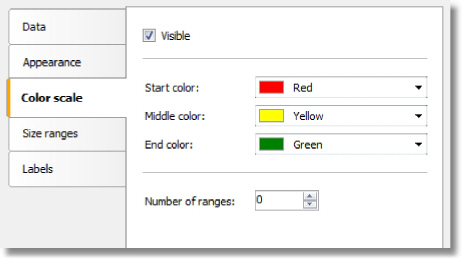
The color scale consists of several ranges. Each range has the following properties: min value, max value and color. You can use as many ranges as you need. To set up the color scale set the number of ranges first and then the properties for each range.
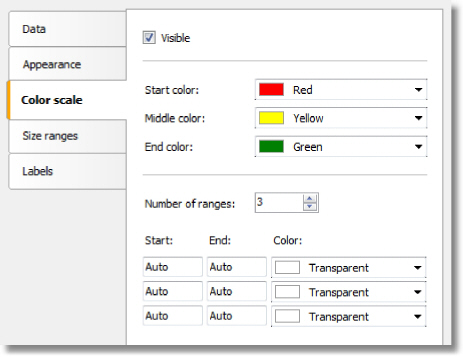
By default all range properties are set to "Auto", meaning FastReport calculates the minimum and maximum values for each range automatically. The auto color is chosen from three presets ("Start color", "Middle color", "End color"). The "Auto" mode may be suitable in most cases.
When a color scale is set up, an indicator control is displayed in the bottom part of the "Map" object:
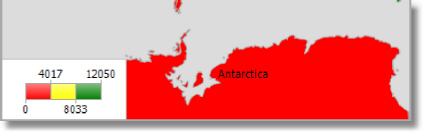
To set the appearance and position of the indicator, select the "Map" element in the layers tree control and switch to the "Color scale" tab:
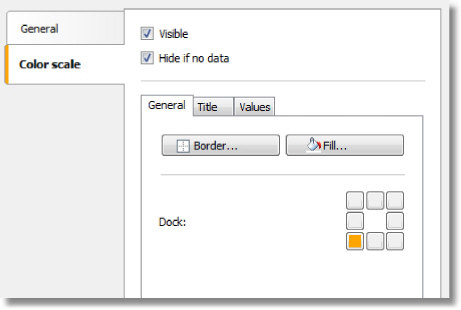
When using layer type •geodata from an application”, the data is displayed as a small circle with a caption. The size of the circle can be bound to the data in the same way as highlighting data using colors. To do this set up the size ranges on the "Size ranges" tab:
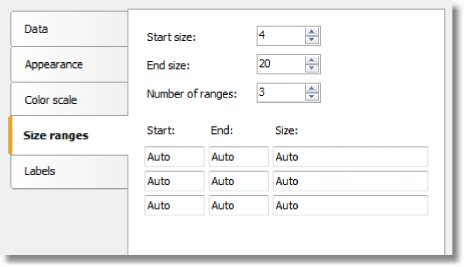
The size ranges have the following properties: min value, max value and size (in pixels). You can use as many ranges as you need. Set the number of ranges first and then set the properties for each range.
By default all range properties are set to "Auto", meaning FastReport calculates the minimum and maximum values for each range automatically. The auto size is chosen from two presets ("Start size", "End size"). The "Auto" mode may be suitable in most cases.